Visualize Your Global Impact with Valotalive DataGlobe
Transform your data into a compelling story and showcase your global reach.
Starten Sie Ihre kostenlose Testversion
- Teste mit deinem Laptop
- Keine Kreditkarte erforderlich
- Jederzeit kündbar
Geolocated Data – Visualized on a 3D Globe
Elevate your brand’s global narrative
Imagine being able to display your global presence in a whole new way.
- Showcase your global reach: Visualize your global office network, highlighting your international presence.
- Map your service coverage: See where your services are used around the world, identifying key markets and potential for expansion.
- Empower your reseller network: Display your reseller locations, strengthening your channel partnerships and demonstrating global reach.
- Track sales volume: Gain insights into global sales performance by visualizing sales volume across different regions.
- And more! The possibilities for data visualization with Valotalive Globe are endless – customize it to fit your specific needs.

Key Features of the Valotalive DataGlobe

Geolocated Data – Data visualization
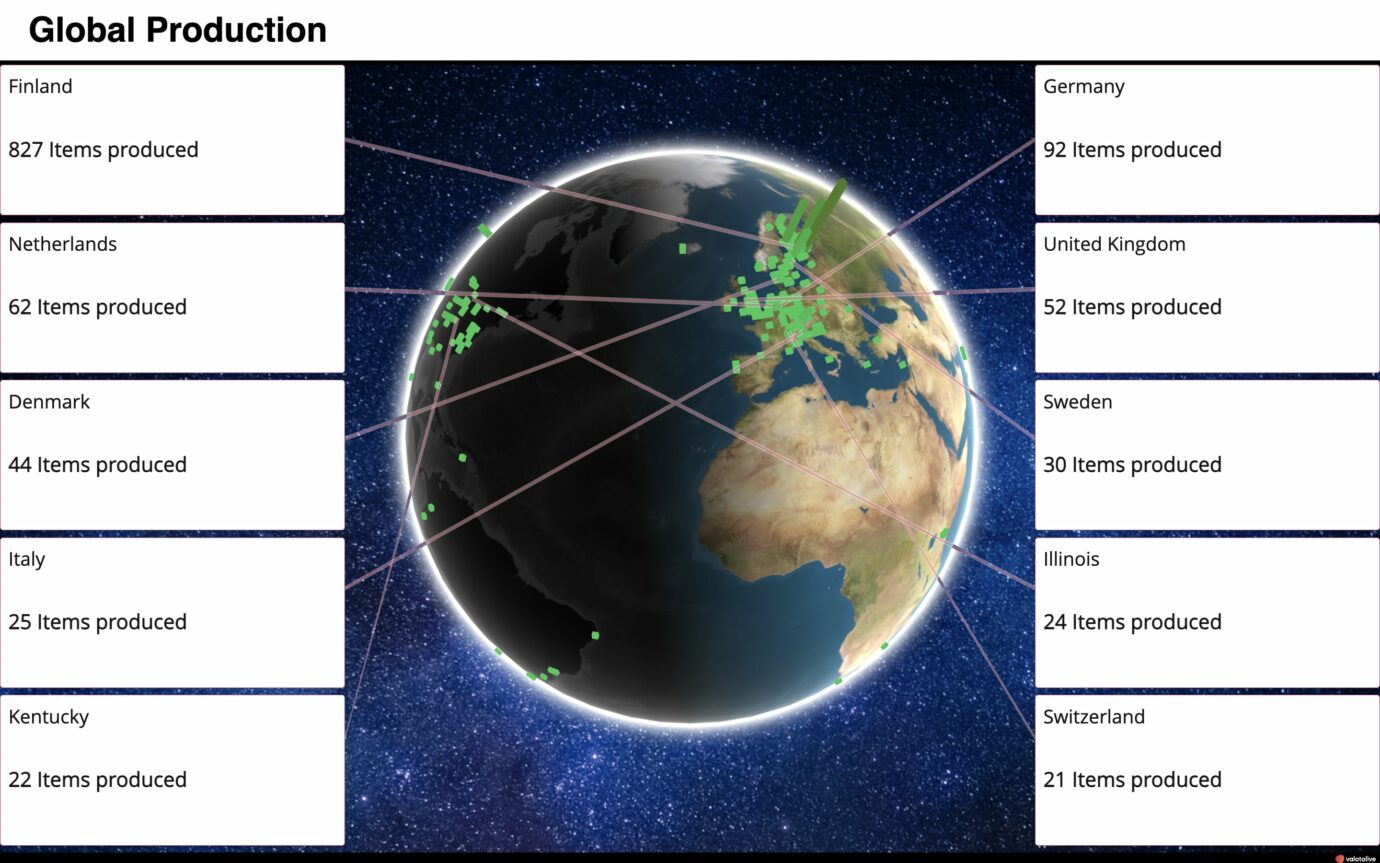
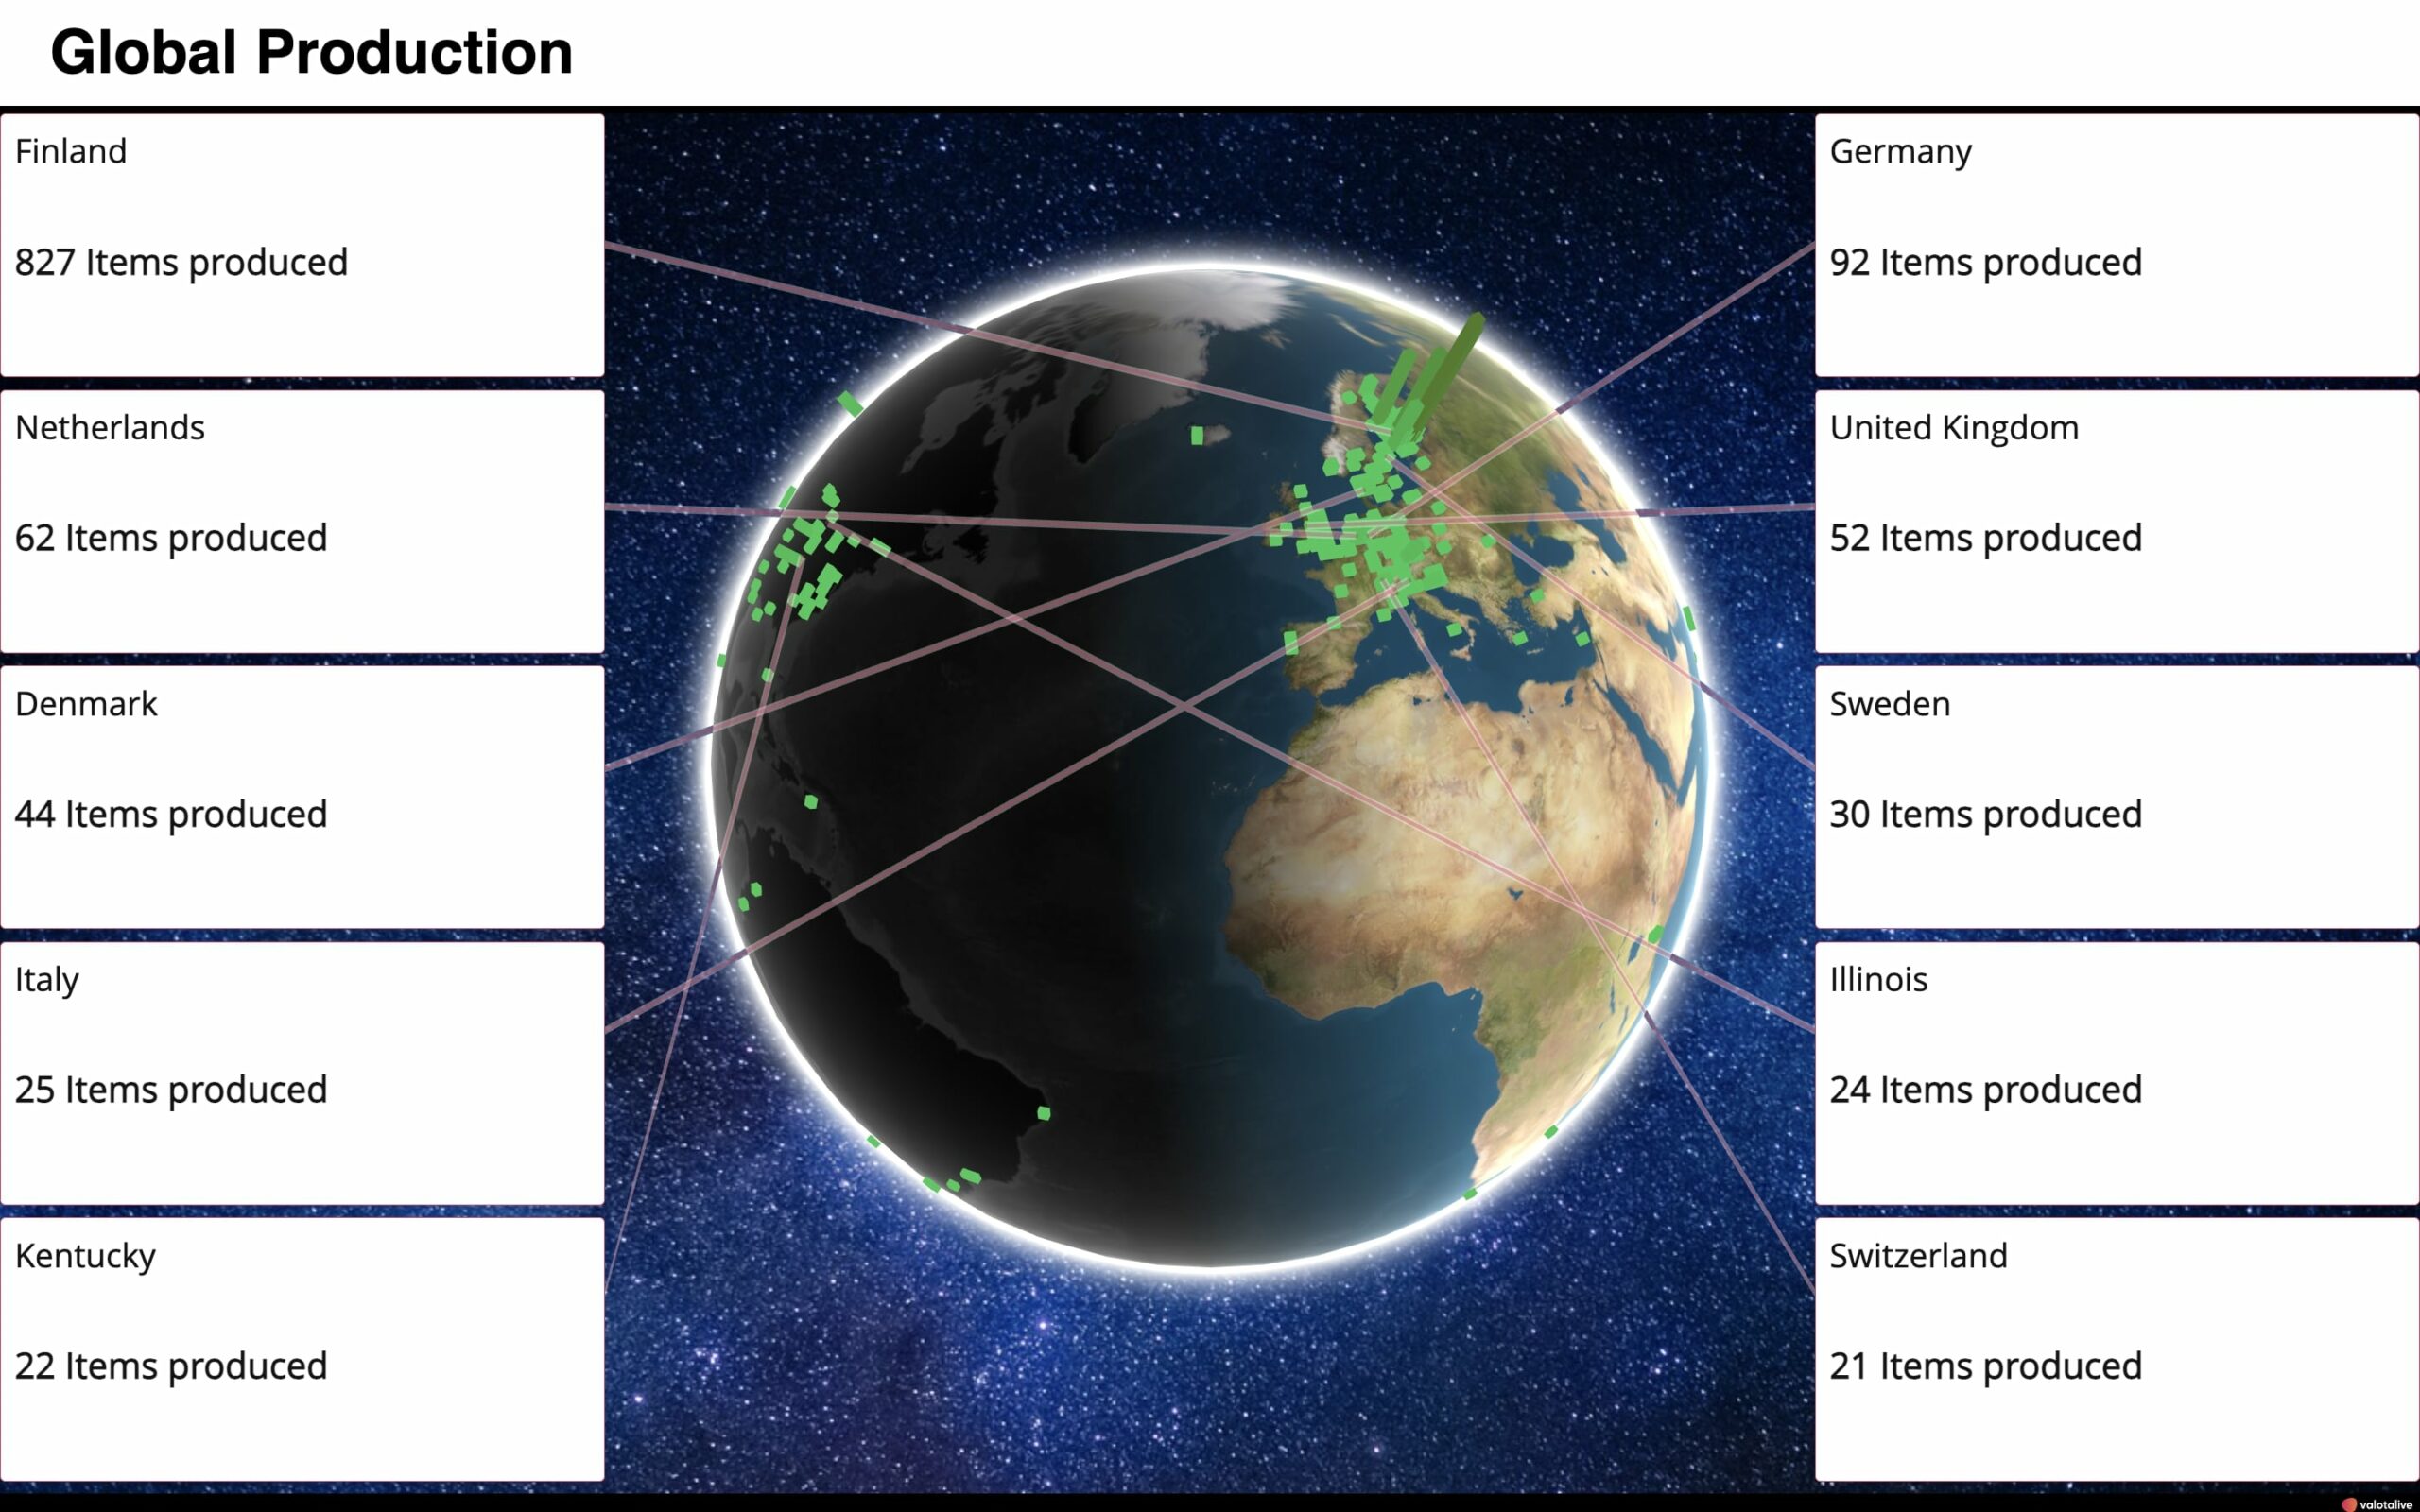
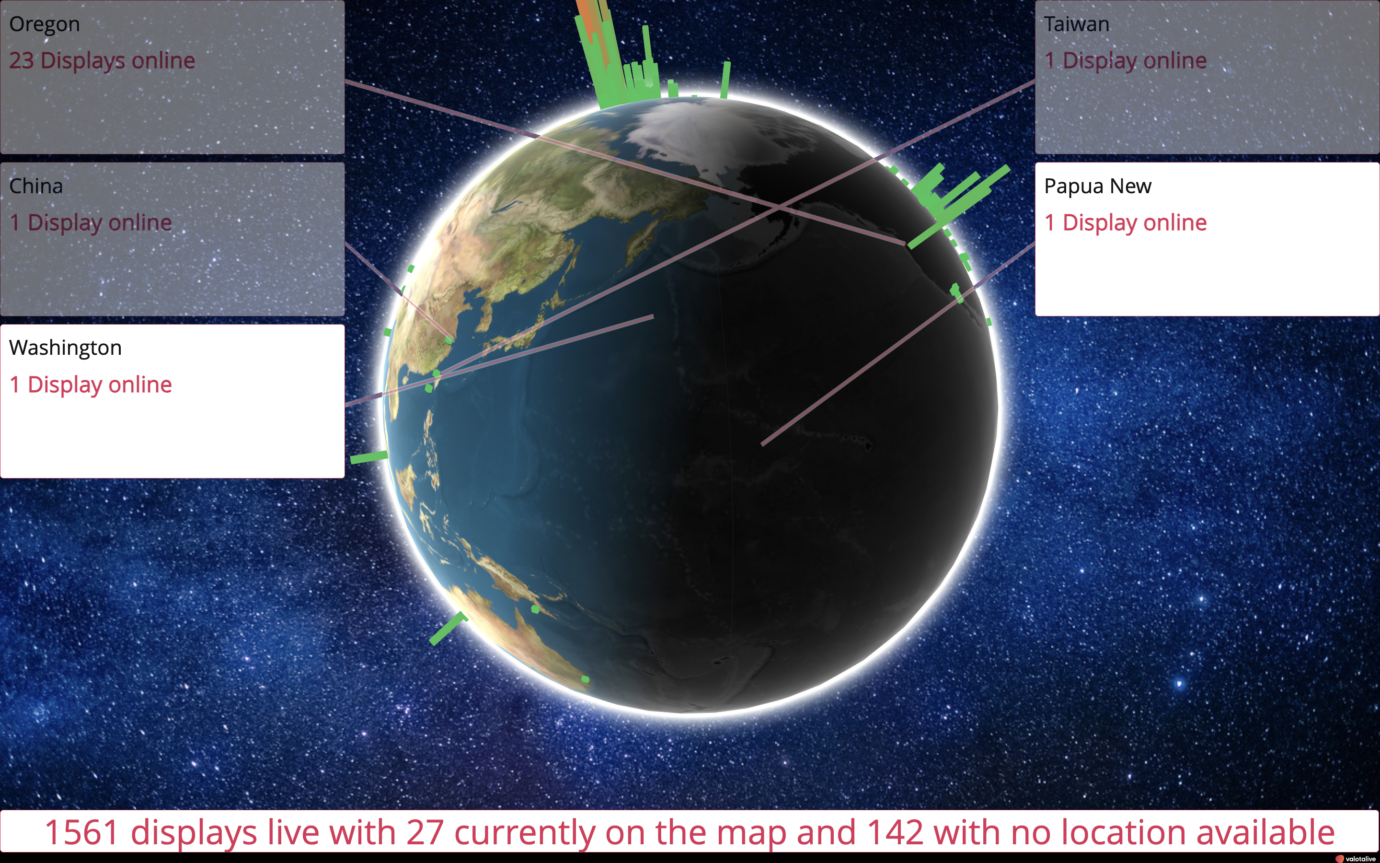
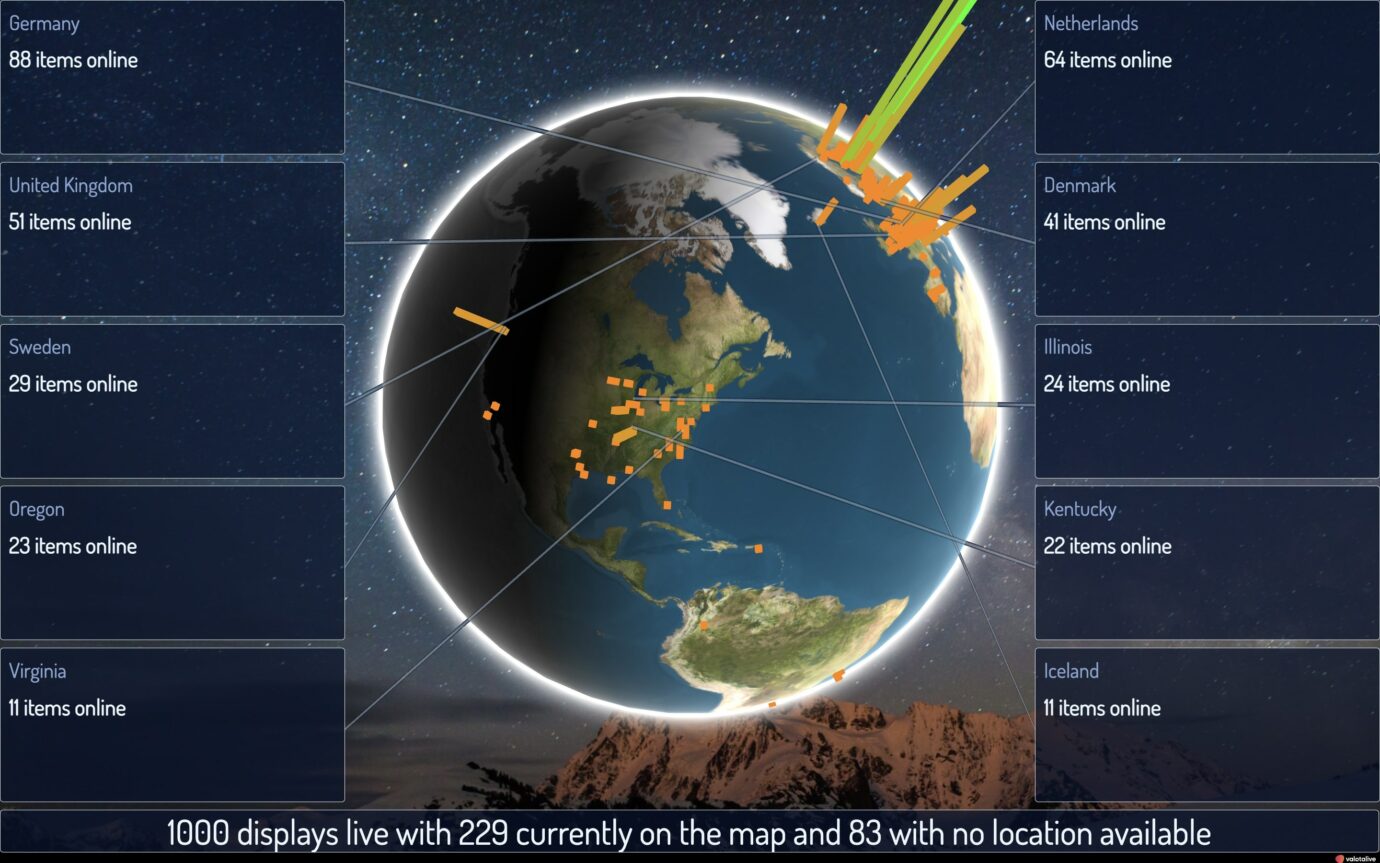
- Transform your data into bars placed directly on relevant locations on our interactive 3D globe.
Immersive Experience
- Explore a smooth, 3D globe with adjustable rotation speed for optimal viewing.

Real-Time Context
- The globe displays a dynamic day/night line that reflects the current time across the planet. 😎
Customize to match your brand
- Tailor the application to your needs with a variety of themes to choose from or craft one of your own.
