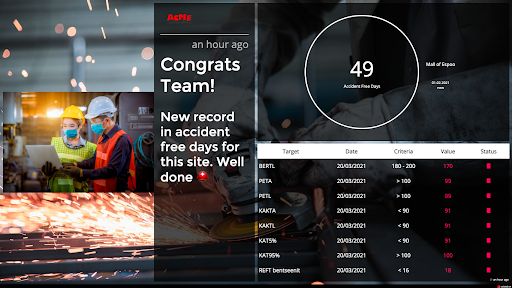
Integrate digital signage with Google Sheets
Automate your KPIs and table data from Google Sheets to digital signage.
Use Google Sheets data to add metrics and visualisations to workspaces across organisations. Share alerts instantly where you know everyone will see them.
Go live with Google Sheets
- Kokeile tietokoneella
- Ei luottokorttia
- Peruuta helposti
Valotalive is trusted by innovative companies
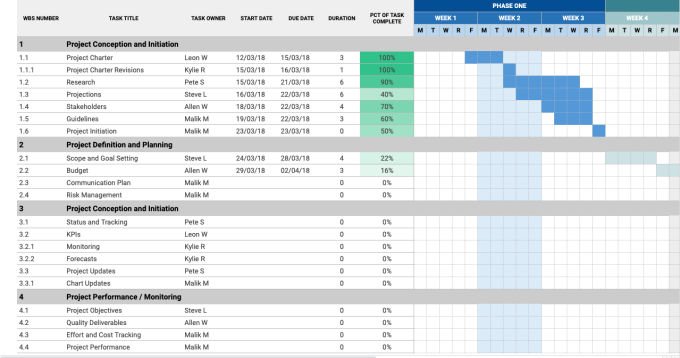
Google Sheets Table
Google Sheets Table app shows your table data on digital displays.
App main features
- Choose the right file from your Google Drive without the need to make your sheet public
- Secure authenticate using Google Sign In
- Easy to use with integration with choose from Google Drive
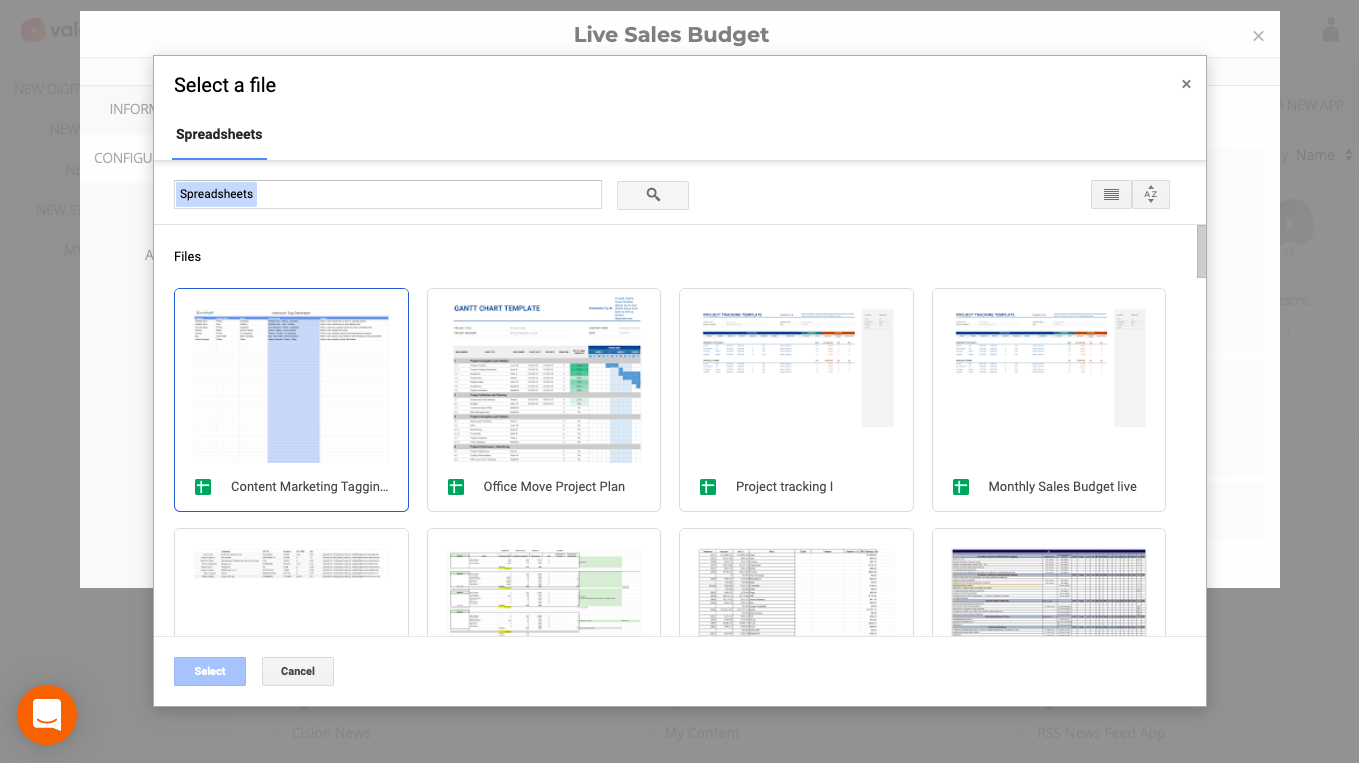
App settings
- Set the desired tab and data Range
- Enable automated scrolling if needed
- Enable automated width if needed
- Create multiple apps out of one Google sheet to target the right content to the right people

KPI Exception Indicator
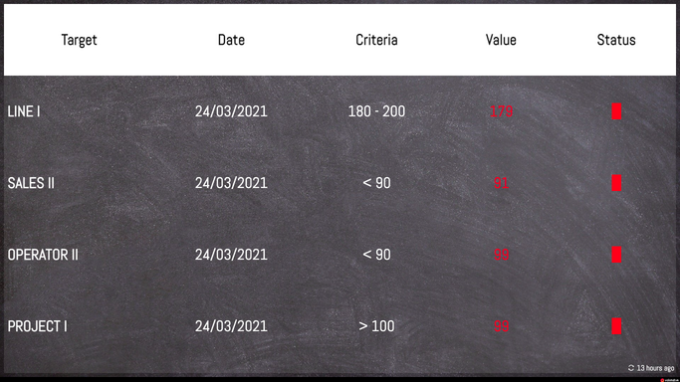
Get notified on digital signage when the operational KPIs are not within the target value. The KPI exception indicator app automatically displays the specific production line, sales or project data on selected displays when the actual number is off the target number.
Share alerts instantly where you know everyone will see them.
App Main features
- Use Google Sheets as your data source
- Bring app upfront when the KPIs are off target
- Optionally hide the app or show “Everything ok” when the KPI is within the target range
- This app works well in the Multiview App
How does it work
Stay hidden when everything is ok
Use Google Sheets as your data source. You can find an example file here.
The indicator can be set, in app settings, to stay hidden when everything is within target limits

Indicate when something is off target
The KPI indicator app activates when one or more KPIs are off targets. The app will display those items and show them as red on your display. Here the app is inside a multiview.
