
Excel Table Data on Digital Signage
Put your Microsoft Excel data on every screen, exactly as it looks in your file. The Excel Table Data app connects to your Microsoft 365 Excel and renders your tables on screen with their cell colours, formatting, and layout intact.
When your data changes in Excel, your screens follow. No copy-paste, no exports, no reformatting. Working in charts instead? See the Excel Charts app.

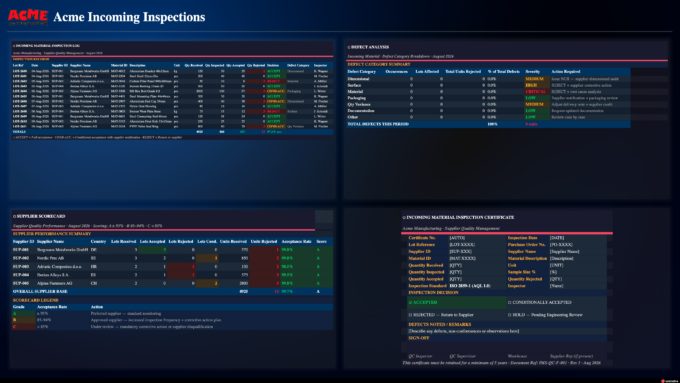
A Spreadsheet on One Laptop Doesn’t Reach the Floor
The numbers that should drive the day are already in Excel: production KPIs, quality logs, shift plans. But they sit in a file on one person’s laptop or in OneDrive, and the frontline teams who need them never open it. The usual workaround, screenshotting the sheet into slides or retyping it onto a board, is manual and goes stale the moment someone edits the file.
Valotalive removes that step. Point your digital signage software at the Excel file and the live data appears on screen, formatted the way you built it.
What You Can Do with Microsoft Excel on Valotalive
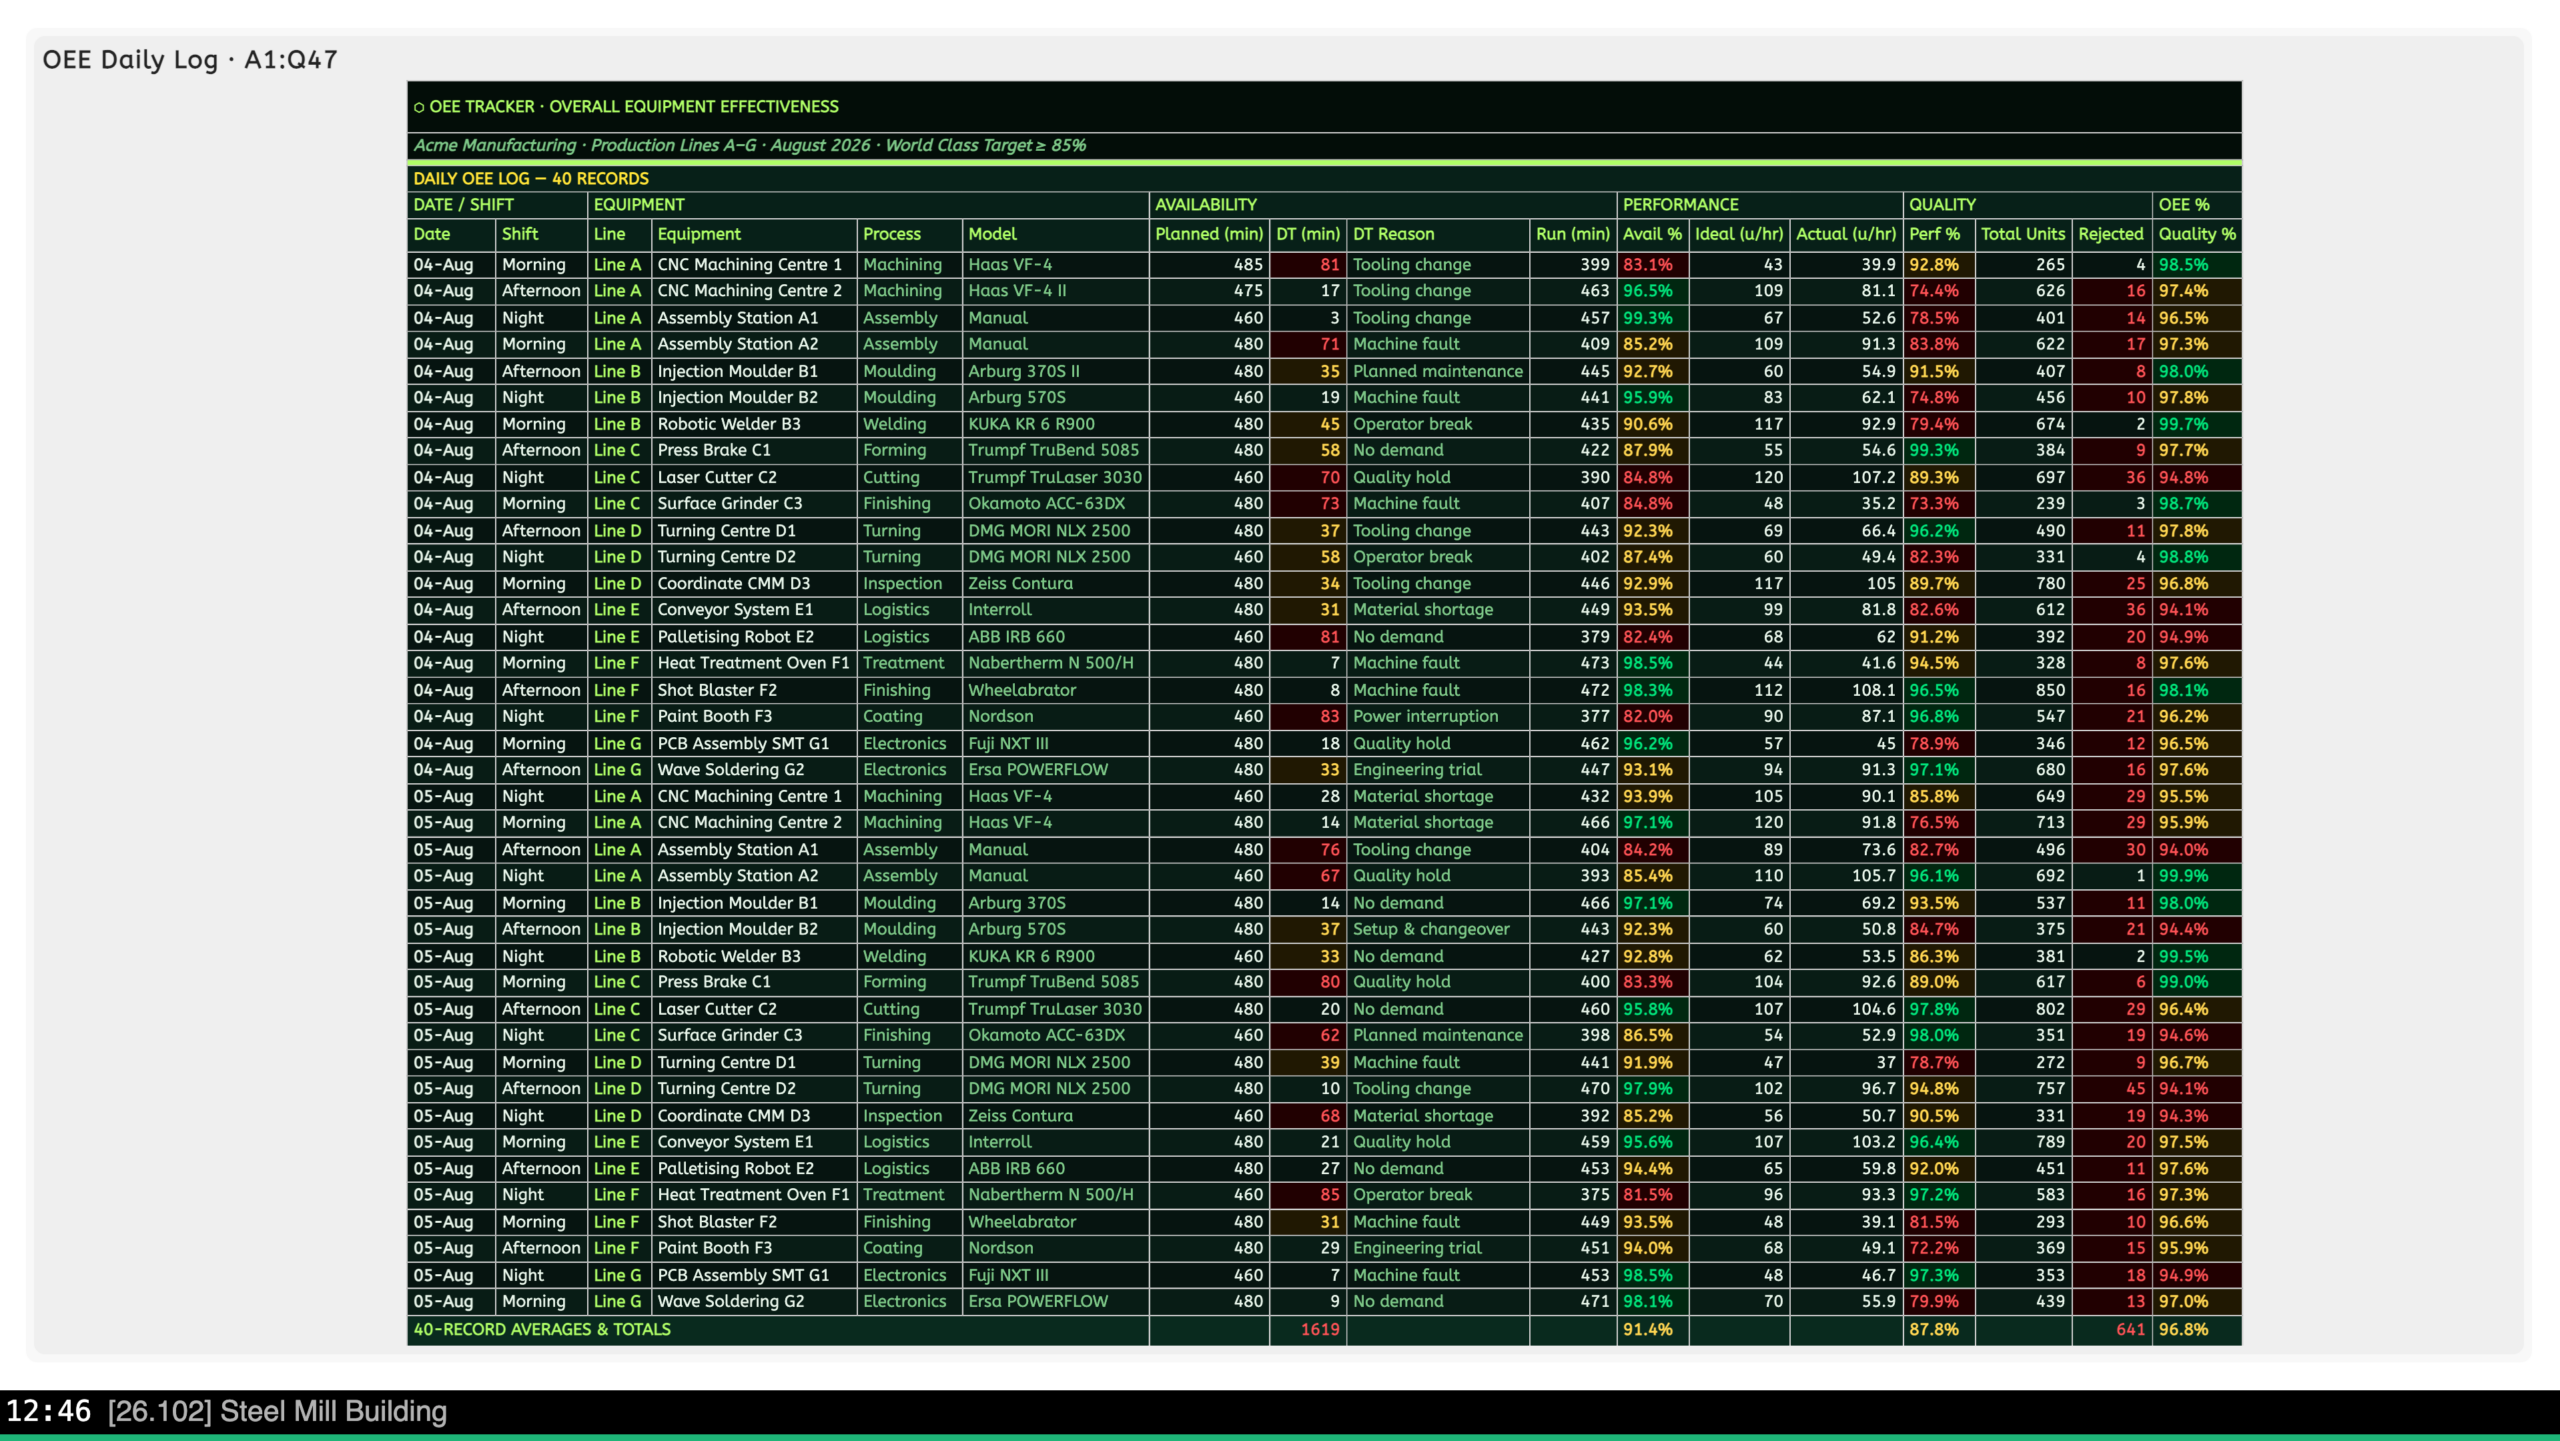
See your spreadsheet exactly as it looks
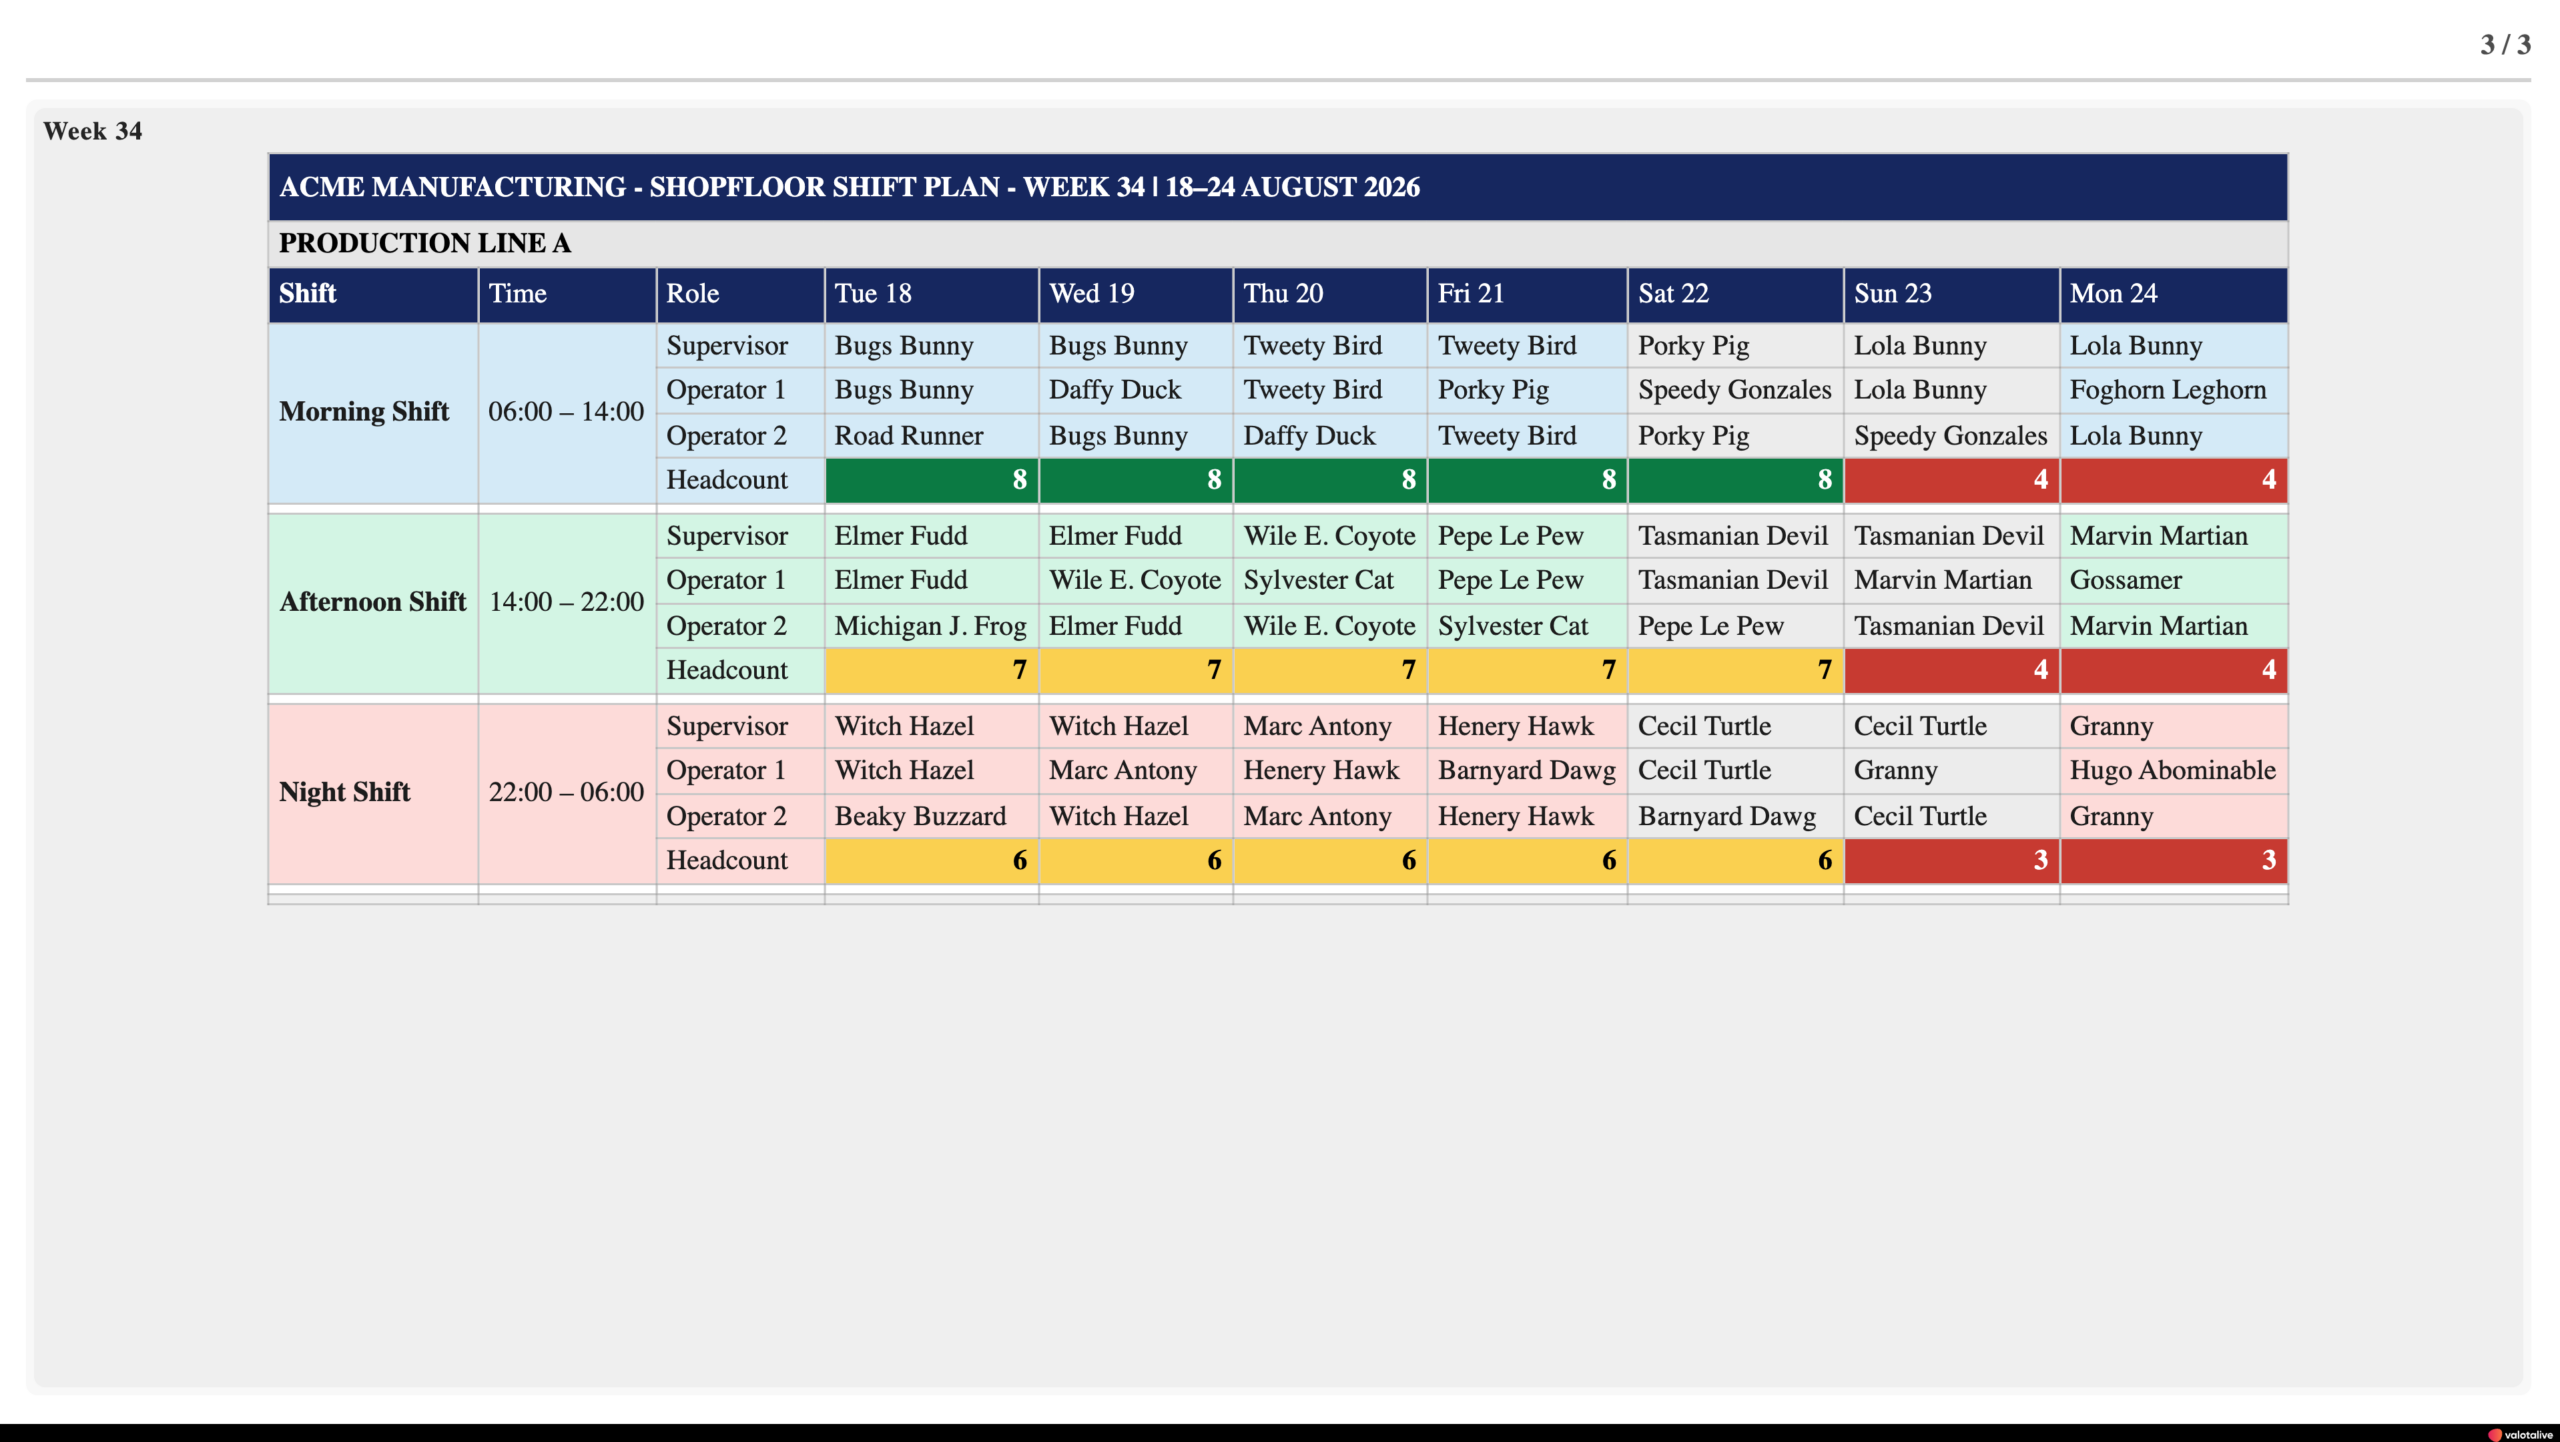
- Cell colours, fills, and formatting render natively on screen. True what-you-see-is-what-you-get.
- Status colour-coding carries across: red for an issue, green for on target, readable from across the floor.
- Header rows and columns stay bold, and empty, hidden, and error cells are cleaned up automatically.
- Keep the column widths from your file, or size them to fit the screen.
Show only the part that matters
- Pick a whole sheet, a single cell range, or specific columns.
- Match sheets by name pattern or position, so the right data shows even when sheet names change month to month.
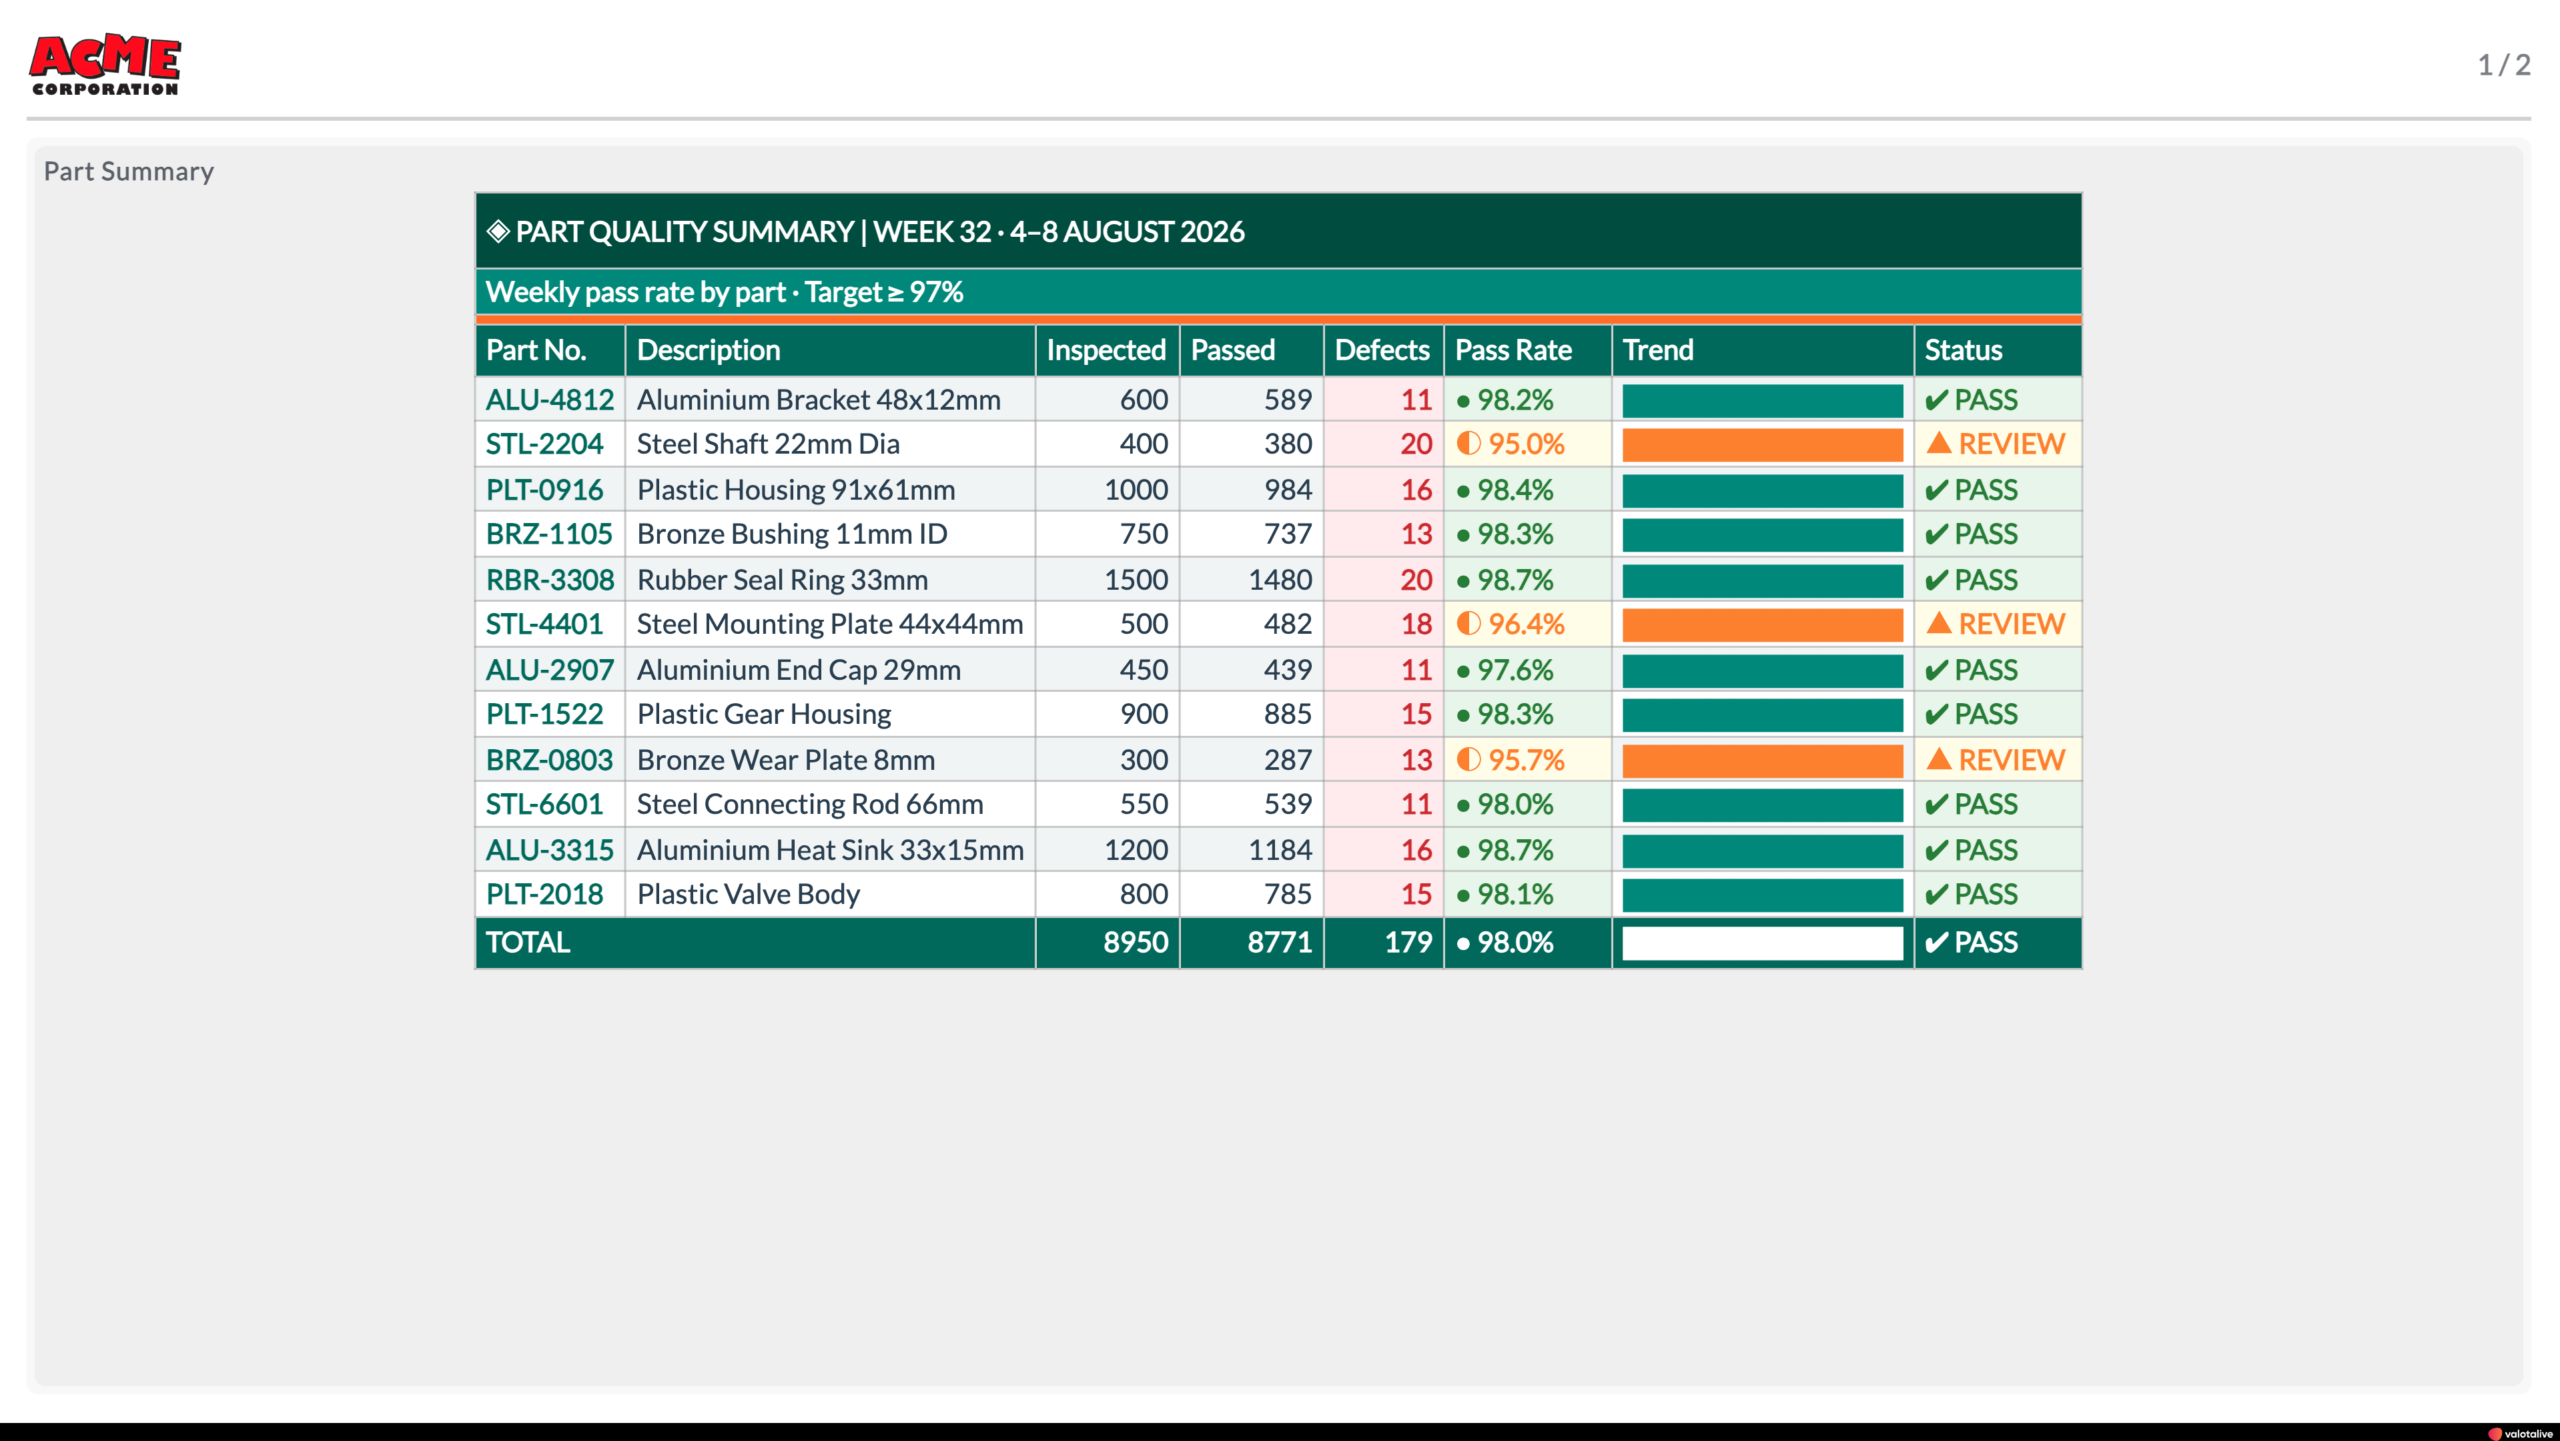
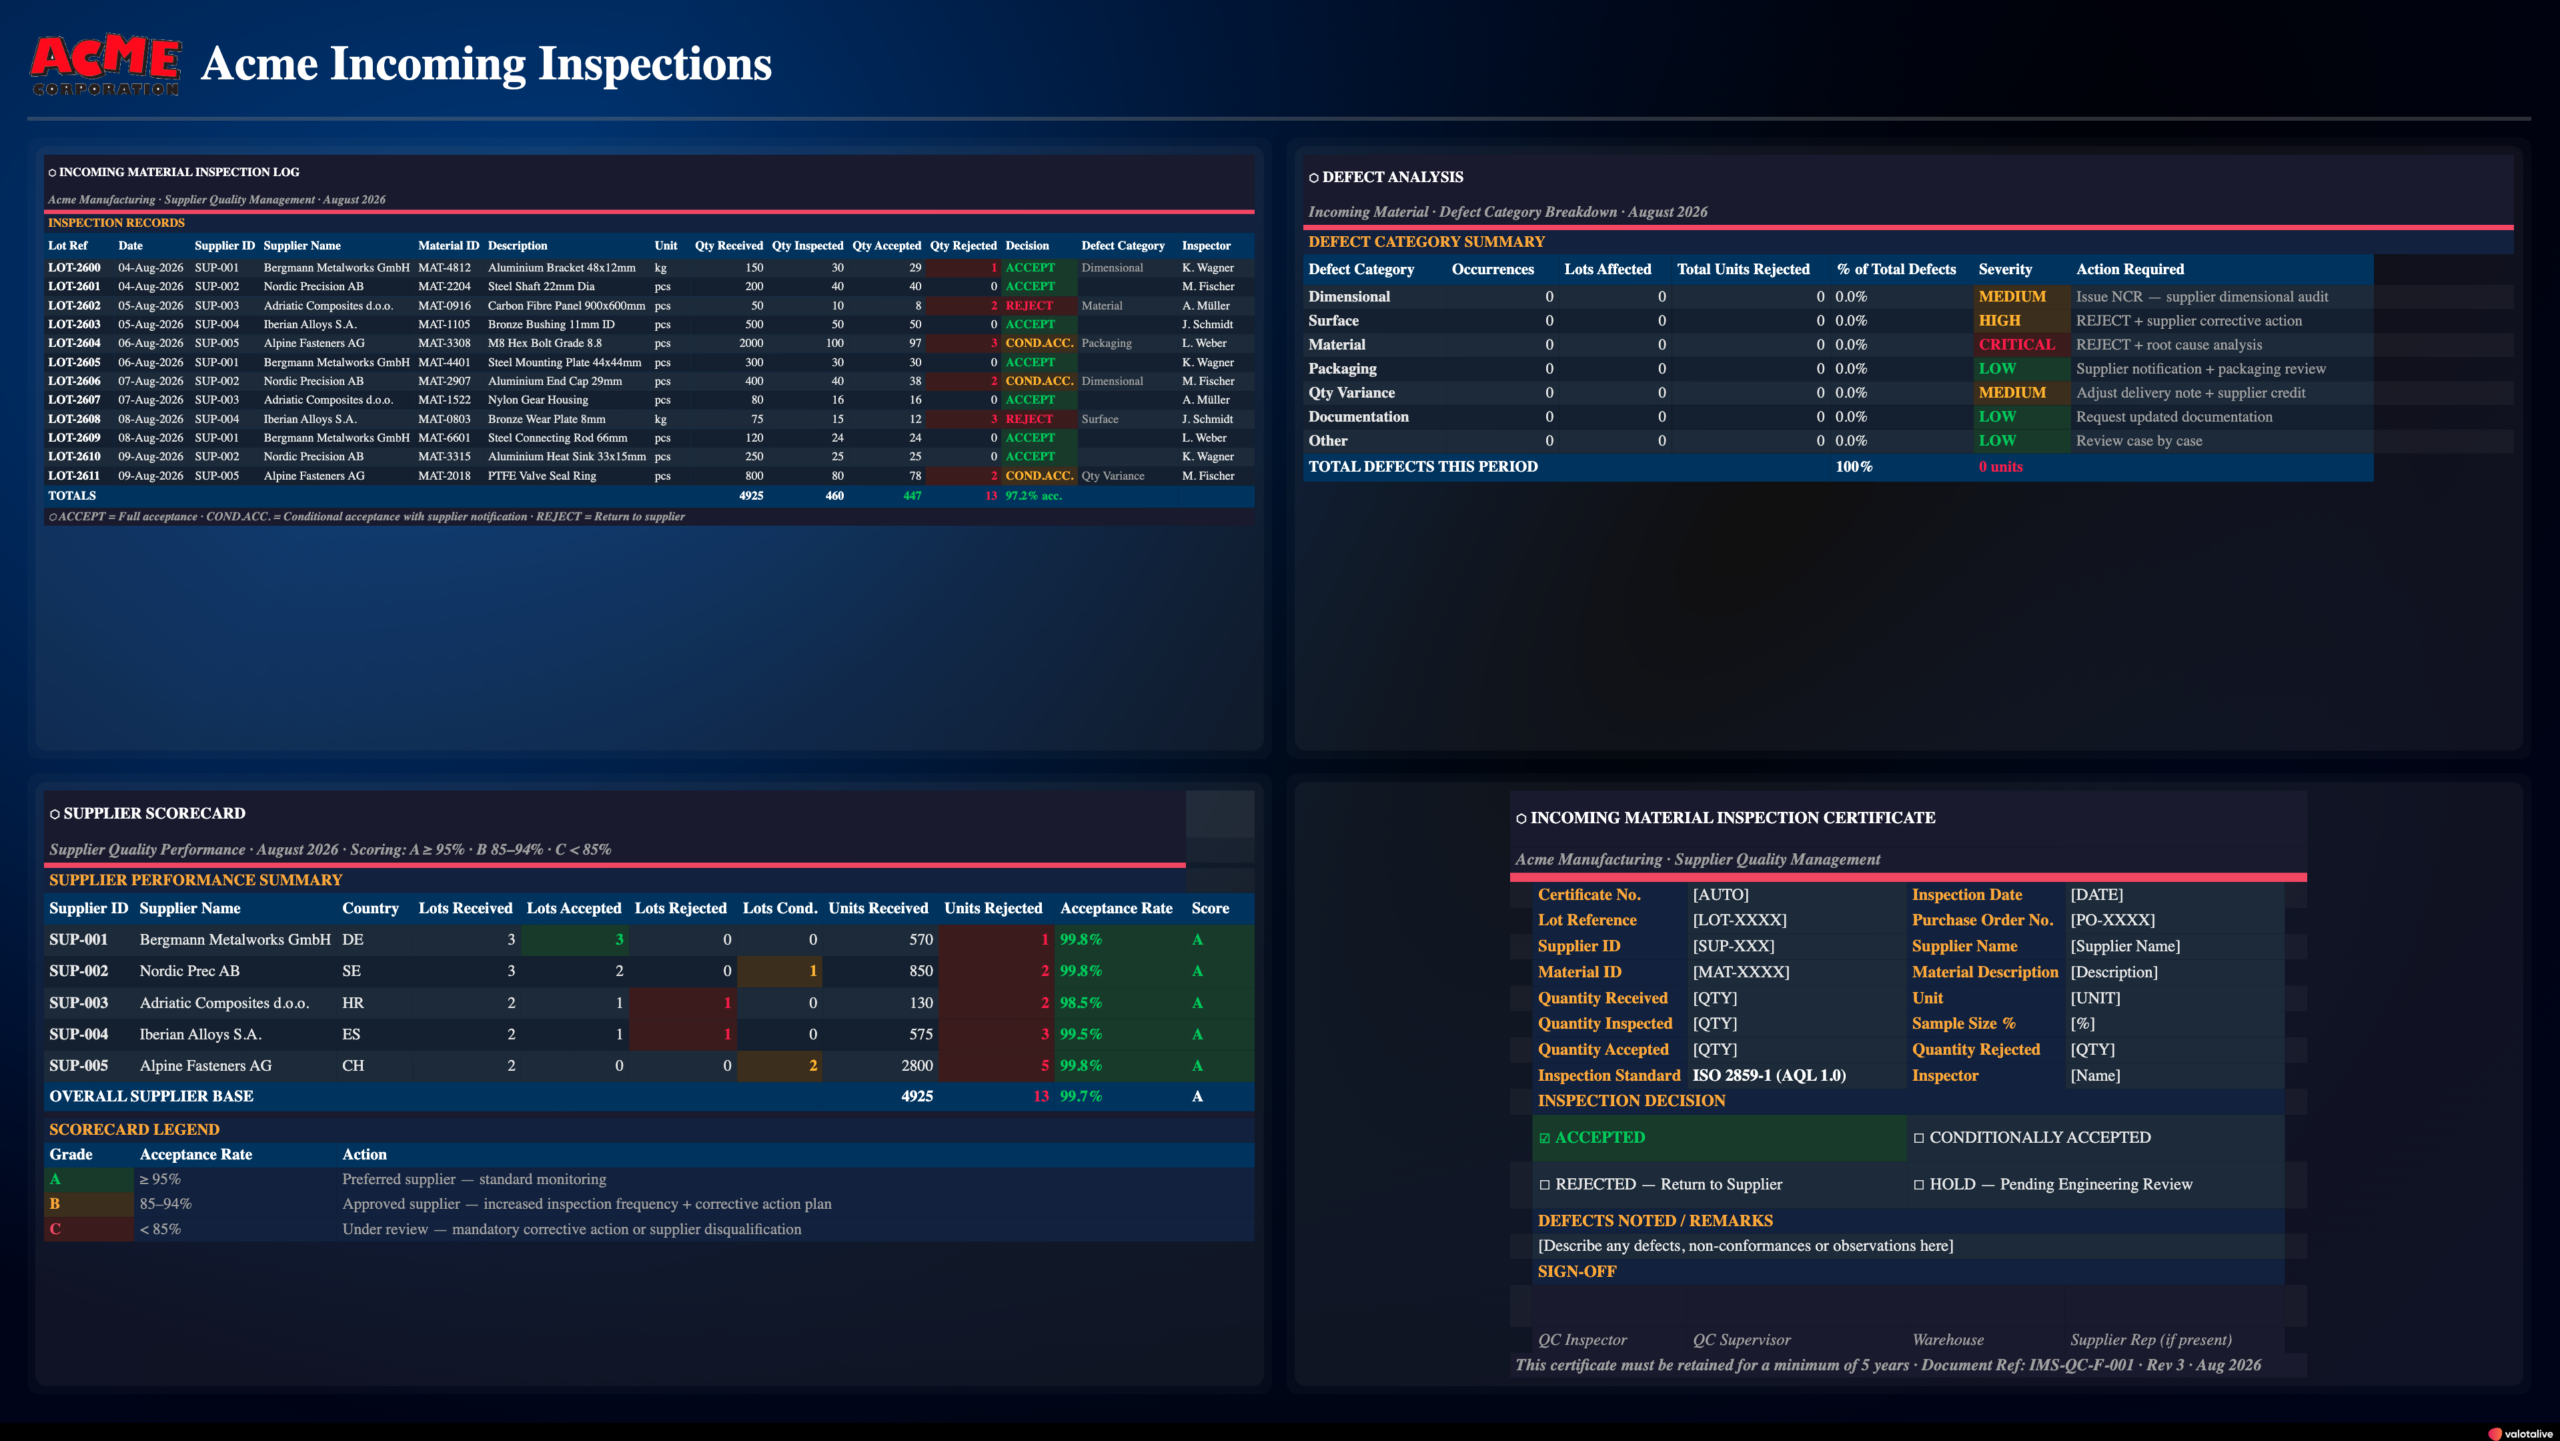
Build one dashboard from several sheets
- Combine several sheets or cell ranges into a single view, shown together on one screen.
- Control the layout: set how many columns the grid uses, or stack the ranges horizontally or vertically.
- Give each view its own heading, so the screen labels what people are looking at.
Keep shift plans and schedules current
- Highlight today marks today’s column in a week or shift plan, and moves automatically at midnight.
- Set how the grid lays out, how long each view stays on screen, and how far small ranges zoom to stay readable.
- The screen refreshes about every 15 minutes, so it keeps pace with the file.
Charts, not tables? The Excel Charts app reads the charts from your Excel file and keeps them live on screen.
Why Teams Put Microsoft Excel on Valotalive

Always current
Update the file and every screen follows. No manual step.

No reformatting
Tables appear as built, colours and layout included.

Status at a glance
Colour-coded cells make problems visible from a distance.

Works with what you have
It runs on the spreadsheets teams already maintain, in Microsoft 365.
Where Microsoft Excel on Signage Fits
The Excel app runs on the same platform as Valotalive’s other data apps. Rotate it with Power BI, Google Sheets, and dashboards in a Valotalive Flow, or give a screen to a single Excel view. It is a core building block for digital signage for data and operational excellence.
Production KPI dashboards
Show live output, efficiency, and quality figures from the Excel sheets teams already maintain.
Shift and week plans
Display the current schedule with today’s column highlighted, so every shift sees what is on.
Quality and inspection tracking
Put QC trackers and inspection logs on screen where the work happens, colour-coding intact.
Tier meetings
Feed the numbers behind a Digital Tier Board straight from Excel.
Frequently Asked Questions
Excel Table Data shows your spreadsheet tables on screen, with their cell colours and formatting intact. Excel Charts shows the charts from your file instead. Use whichever matches your content, or both on different screens.
No. Multiview is a separate app for combining different apps on one screen. Excel Table Data combines sheets and ranges from one Excel file into a single view, with its own grid layout.
Files in your Microsoft 365 cloud Excel, in OneDrive or SharePoint. Pick the file with the OneDrive file picker and authenticate with your Microsoft Entra ID account. Step-by-step: How to activate the Excel Table Data app.
Yes. With cell colours on, Valotalive renders the file as what-you-see-is-what-you-get: background colours, fills, and highlights appear exactly as in Excel. See layout and appearance.
Yes. Choose a single sheet, a cell range, or specific columns, and combine several into one view. You can also match sheets by name pattern or position. See how to configure views.
No. Use an open-ended range such as Sheet1!A1: and the view always includes everything down to the last row.
The app checks the file about every 15 minutes and shows the newest saved version. Faster update cycles are possible for specific needs.
Yes. Add the app to a Valotalive Flow to cycle it with dashboards, Power BI, and other apps on one screen, or give it a dedicated screen.