Digital Signage for Data & Operational Excellence
Use data-driven management to improve safety, quality, and productivity in industrial operations. Valotalive brings live KPIs and dashboards from your BI tools to frontline teams on every site and shift. For Operations, Operational Excellence, EHS, Quality, and BI leaders.

How to Use Operational Data on the Shop Floor
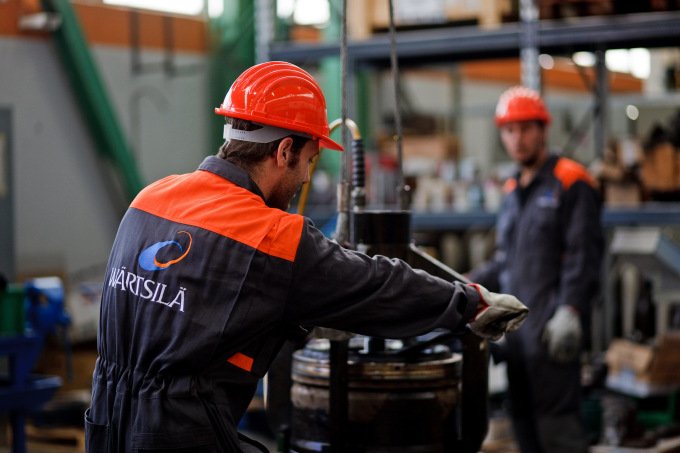
Critical KPIs live in Power BI, Excel, ERP and MES – but only office staff and managers see them. Frontline teams rely on manual printouts, whiteboards, or logging in to shared PCs, so data is always late or incomplete.
Digital signage for operational data pushes live dashboards and alerts directly to production lines, warehouses, and control rooms, so teams see what matters, when it matters.
From Data to Operational Excellence
- Industrial operations are where value is created – on production lines, in warehouses, at loading docks.
- Data-driven management is how you steer those operations using real-time KPIs, trends, and deviations.
- Operational Excellence is the outcome when this happens consistently across sites and shifts.
Valotalive acts as the “last mile” of data-driven management – making your existing BI dashboards and operational KPIs visible on large screens where decisions and actions happen. See how teams use production dashboards on the factory floor. Read our CGO’s perspective on how B2B digital signage evolved into an operational workspace.

Key Benefits for Industrial Operations

- Reduce unplanned downtime: Spot deviations in OEE, scrap, and throughput early, so teams can react before issues escalate.
- Improve safety performance: Keep accident-free days, TRIF/LTIF, near-miss trends, and safety actions visible to everyone on every shift.
- Increase quality and first-pass yield: Show defect rates, rework, and non-conformities in real time to drive systematic problem-solving.
- Boost BI impact and adoption: Turn existing Power BI and Excel dashboards into shared, always-on visibility for frontline teams.
- Align sites and shifts around the same KPIs: Ensure every factory and warehouse is working from a single source of truth instead of local spreadsheets and boards.
Turn Tier Meetings into Data-driven Huddles
- Use Valotalive as your Digital Tier Board in tier meetings
- Add the Action Items Tracker sub-app to capture and track follow-through on actions assigned during tier meetings.
- Use the Interactive Notice Board for self-service information displays in break rooms, lobbies, and production floors — no meeting structure needed.
- Tier 1: Frontline teams can view the current safety, quality, and production status on area screens.
- Tier 2–3: supervisors and leadership see aggregated site or network-level dashboards.
- Replace manual whiteboards and marker updates with automated digital performance boards that always show the latest data.
- During huddles, quickly switch between Safety, Quality, Production, and Logistics views using the interactive board feature.

Operational Data Use Cases
Use live data dashboards to ensure everyone is on the same page. Valotalive helps you improve data-driven management by displaying real-time production, quality, or WMS data directly on the floor
Production & Maintenance
- Production line monitoring: Live throughput, cycle time, downtime by reason, and OEE (availability, performance, quality) per line or cell.
- Machine capacity & maintenance: Machine utilisation, hours to next planned maintenance, and alerts for upcoming or overdue work.
- Energy & resource consumption: Real-time electricity, water, compressed air or other resource usage to support cost and sustainability targets.
EHS & Safety
- Safety KPI dashboards: TRIF, LTIF, and other incident rates visible on shop floor and warehouse screens.
- Accident-free and incident visibility: Automated accident-free days counters plus near-miss and incident trends.
- Compliance monitoring: Training completion, mandatory certifications, and site-specific safety requirements highlighted where they matter.
- Safety campaigns and alerts: Safety reminders, campaign messages, and critical alerts across all screens.

Quality
- Yield and defect tracking:
- First-pass yield, scrap, rework rates, and
- top defect categories.
- Non-conformities and CAPA: Open non-conformities and corrective actions with status and owners.
- Quality alerts: Visual alerts when key quality limits are exceeded, so teams can react immediately.
Supply Chain & Logistics
- Supply chain visibility: Status of inbound materials and outbound deliveries, with potential delays highlighted.
- Inventory management: Stock levels for critical components, low-stock alerts, and stock turnover on logistics and production-area screens.
- Warehouse operations: Picking accuracy, order backlog, and task queues.
- On-time delivery & SLA: On-time delivery performance, dock utilisation, queue lengths, and SLA adherence at docks and staging areas.

Leadership & Performance Management
- Leadership dashboards: Site-level or group-level operational dashboards (production, safety, quality, logistics) on office and control room screens.
- Strategic and financial KPIs: Corporate KPIs (e.g., revenue, margin, customer satisfaction) and key cost drivers tied back to operational performance.
- Program visibility: Progress on Operational Excellence, continuous improvement, and sustainability initiatives across sites.
Smart Integrations for Operational Data
Integrations
Valotalive connects to Power BI, Excel, Google Sheets, SAP Analytics Cloud, ERP/MES and other operational systems.
Automation
Update once, publish everywhere: When a dashboard, sheet, or KPI changes, screens update automatically.
Management
Define what to show where: Map views to sites, lines, areas, or shifts; centralise control, fine-tune locally.
Security
IT- and security-friendly: Access control and network security designed for industrial environments.
“Great Service and Product, ★★★★★”
-Director in Machinery, United States
Verified Reviewer in Capterra