
Excel Charts on Digital Signage
Show your Microsoft Excel charts on any screen, live. The Excel Charts app reads the charts from your Microsoft 365 Excel file and displays them on screen, updating as your data changes.
Want your tables and cell data on screen instead, rendered exactly as in your file? See the Excel Table Data app.

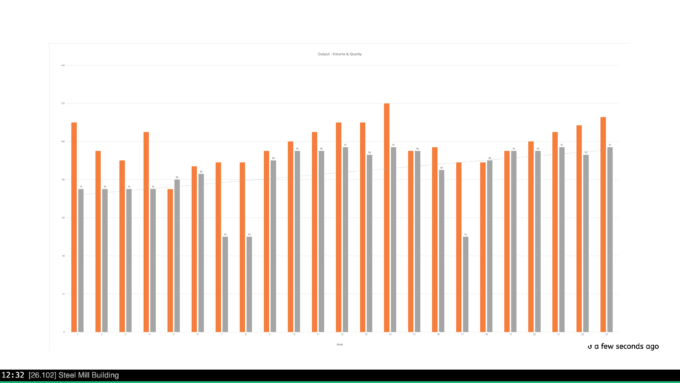
Charts That Stay in the File Don’t Get Seen
Your Excel charts summarise what matters: output, quality, trends over time. But they sit in a workbook on someone’s laptop, and the teams who should act on them rarely open it. Screenshotting a chart into slides goes stale the moment the data moves.
The Excel Charts app puts them on screen and keeps them current. Point your digital signage software at the file, and the charts appear, refreshed automatically.
What You Can Do with Excel Charts
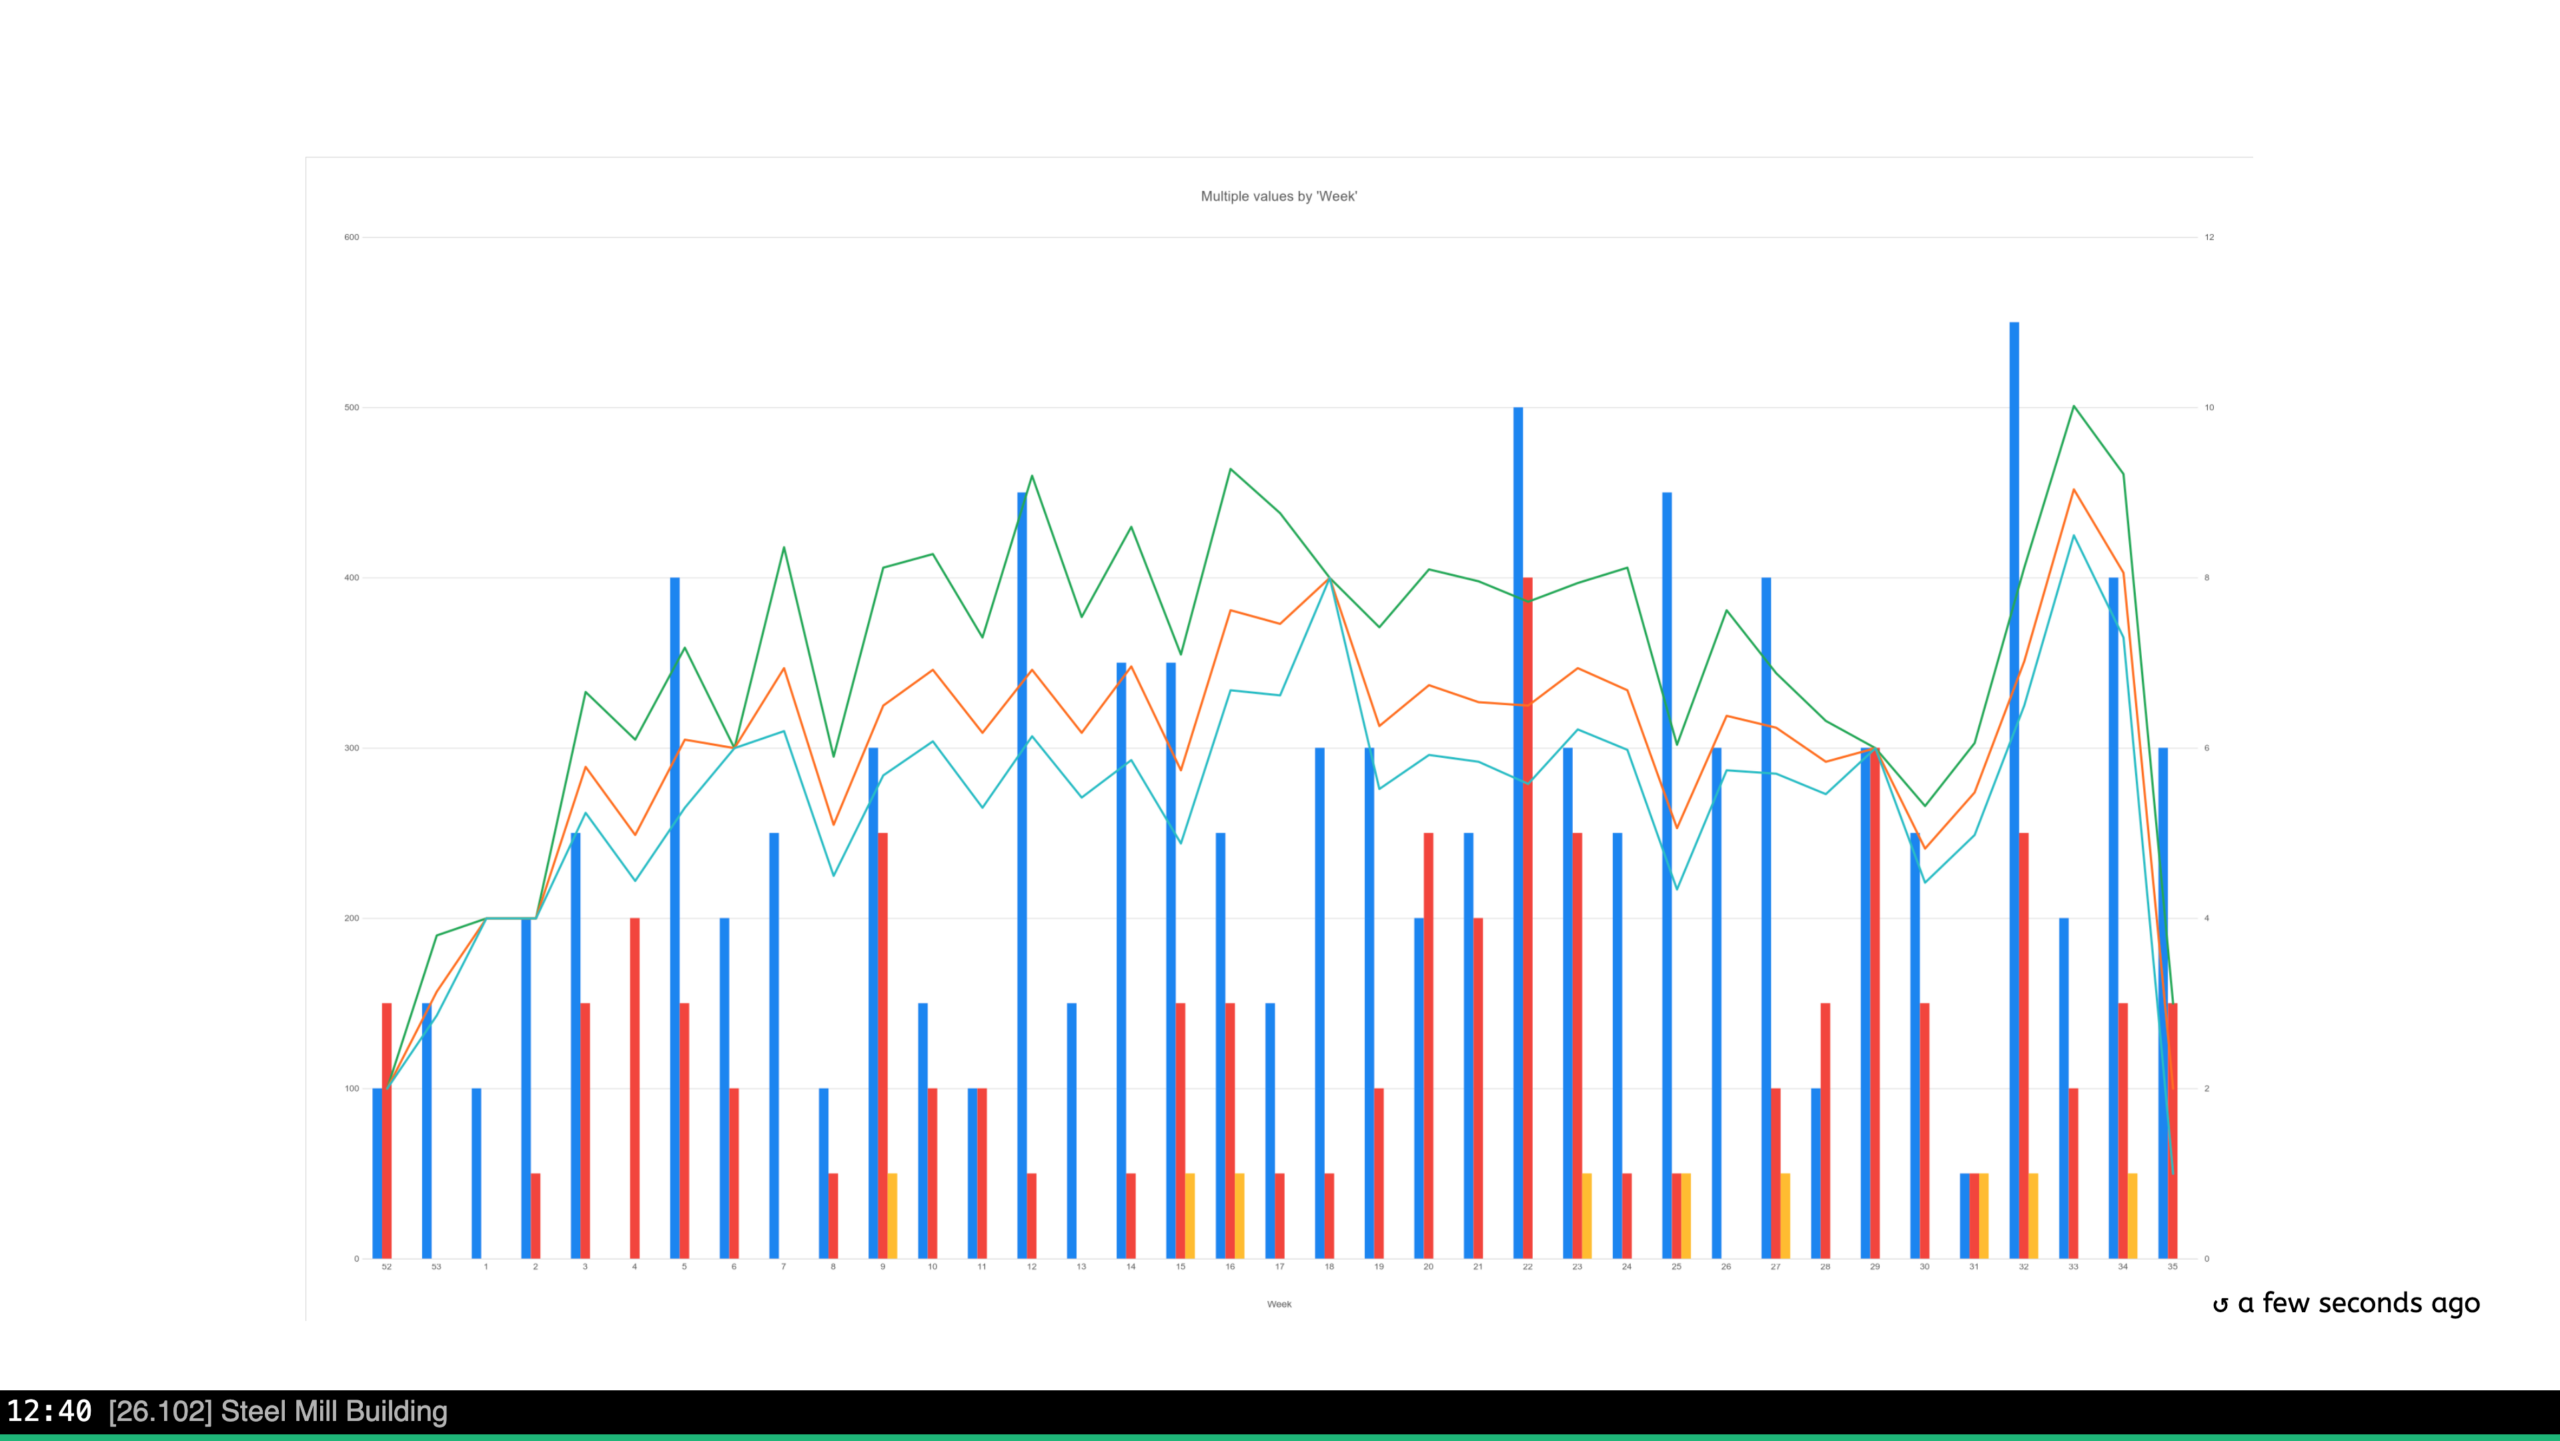
Show every chart in your workbook
- Automatically detects and displays all the charts in your Excel file. No manual selection.
- Charts appear exactly as you formatted them: colours, labels, and legends intact.
- Cycles through multiple charts, each shown for a duration you set.
Keep them live
- Connects to your Microsoft 365 Excel with a secure Microsoft Entra ID sign-in.
- When the data changes in the file, the charts on screen follow.
- No exporting, no re-uploading.
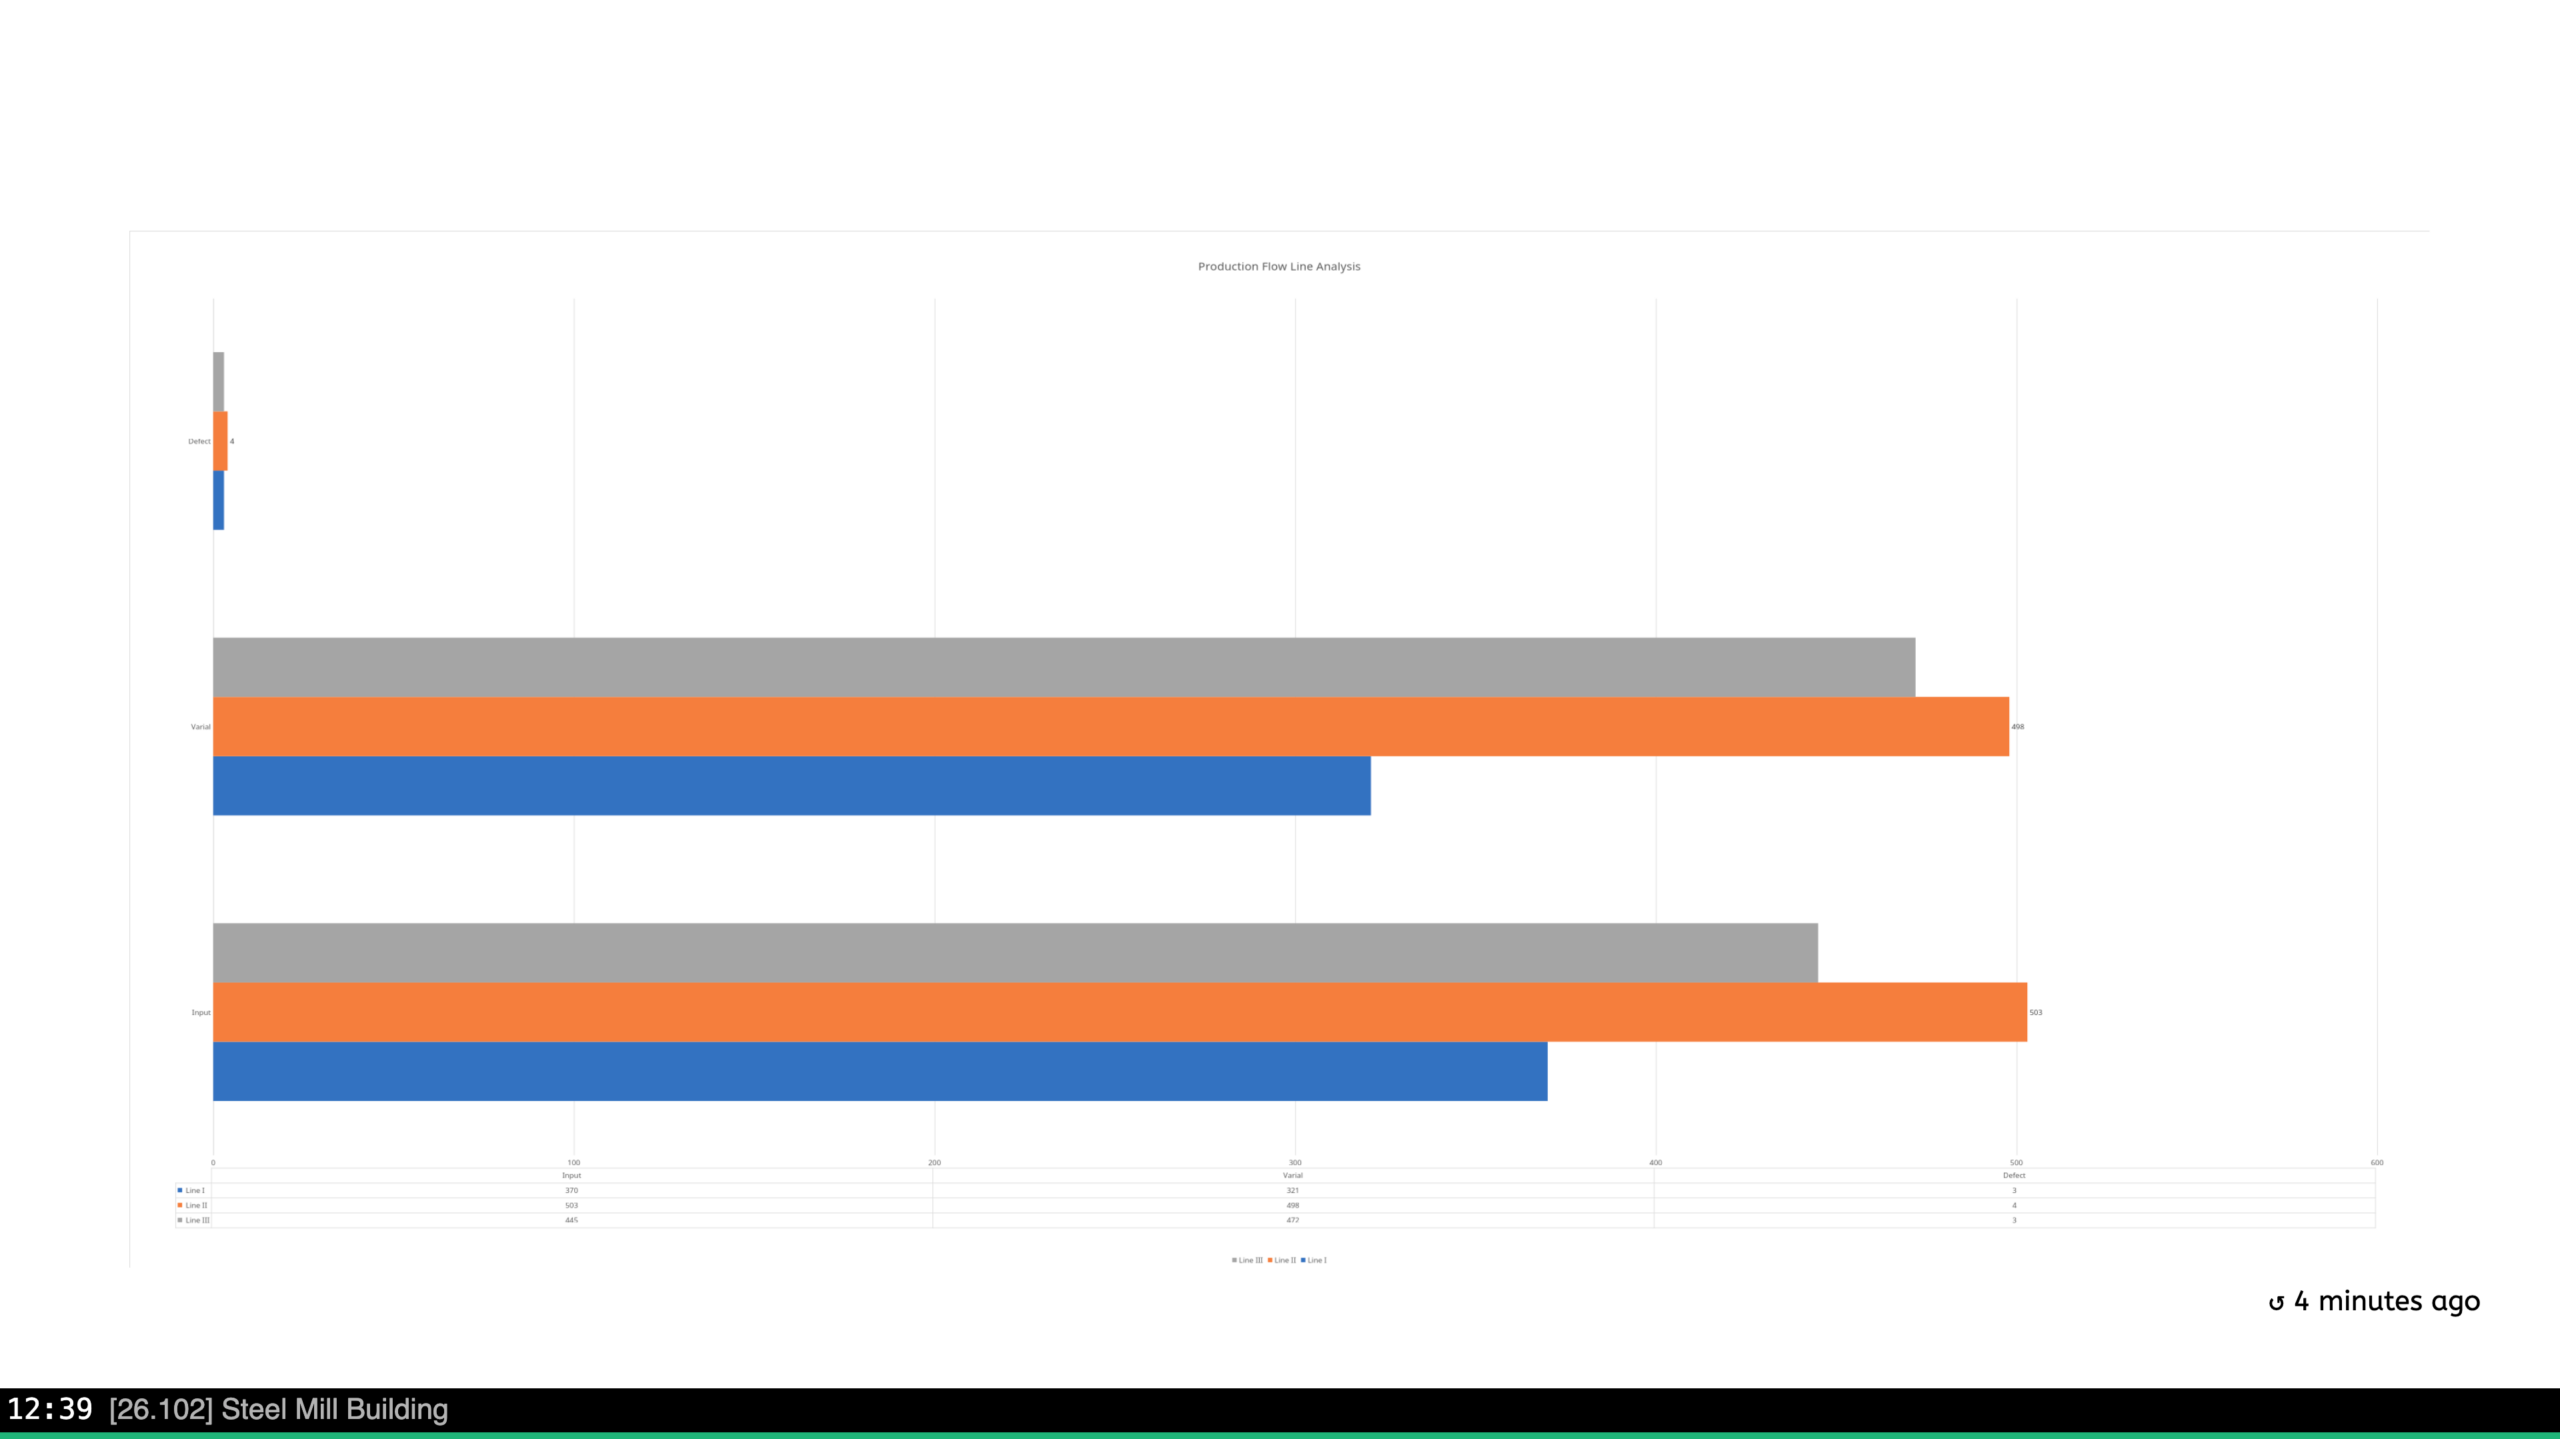
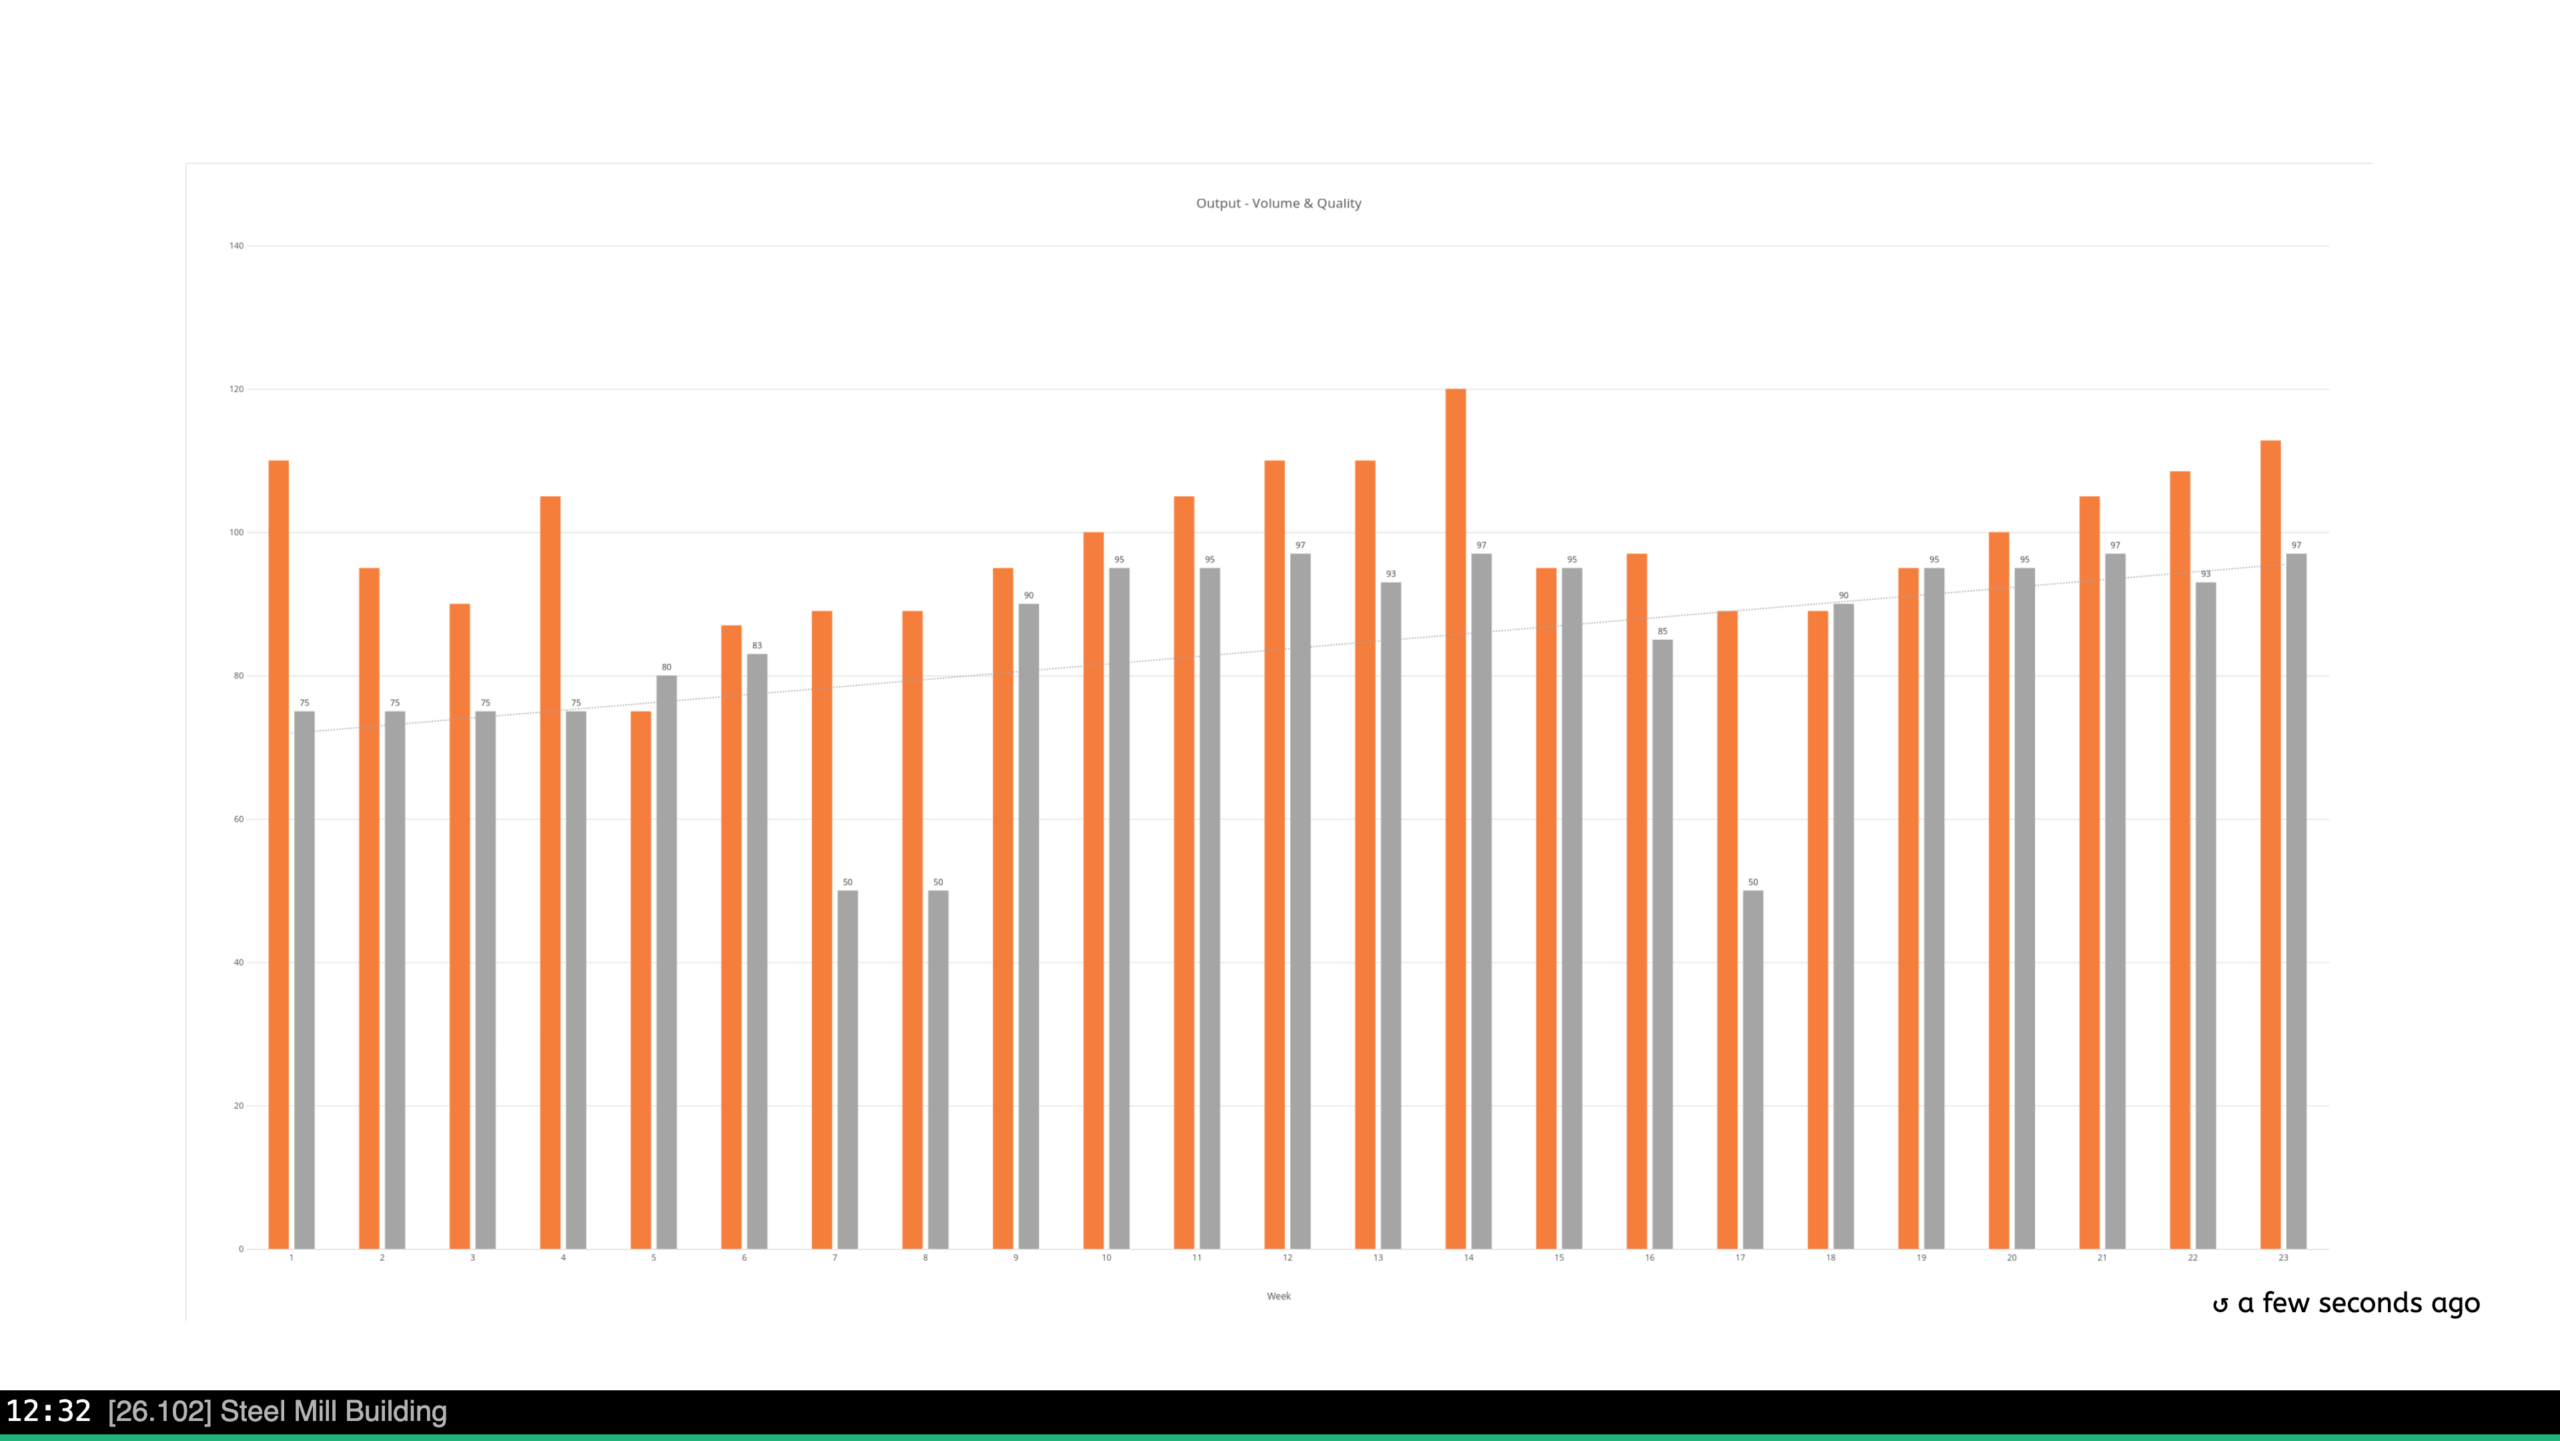
Put charts on any screen
- Add the app to a single display, or into a Valotalive Flow.
- Rotate your charts with dashboards, tables, and other apps in one rotation.
- Pair it with the Excel Table Data app to show charts and tables together.
Need the cell data too? The Excel Table Data app shows your full spreadsheet on screen, formatted exactly as in your file.
Why Teams Put Excel Charts on Screen

Always current
The charts update as the Excel data changes.

Exactly as built
Your formatting, colours, and labels carry across.

Zero upkeep
Publish once in Excel; the screen keeps itself current.

Works with what you have
It runs on the Excel charts your teams already build.
Where Excel Charts Fits
The Excel Charts app runs on the same platform as Valotalive’s other data apps. Rotate it with Power BI, tables, and dashboards in a Valotalive Flow. It supports digital signage for data and operational excellence.
Production trends
Show output, efficiency, and quality trends over time, straight from the Excel charts your teams maintain.
KPI summaries
Put the summary charts from a management workbook on screen for everyone to see.
Review and tier meetings
Bring the charts behind a Digital Tier Board onto the meeting screen.
Frequently Asked Questions
Excel Charts displays the charts from your file. Excel Table Data shows your spreadsheet tables on screen, with cell colours and formatting intact. Use whichever matches your content, or both on different screens.
Files in your Microsoft 365 cloud Excel. You authenticate with your Microsoft Entra ID account and pick the file, which lives in OneDrive or SharePoint.
No. The app automatically detects and displays all the charts in the file, and cycles through them.
Yes. Charts appear on screen exactly as they are formatted in Excel: colours, labels, and legends.
Yes. Add the app to a Valotalive Flow to rotate it with dashboards, tables, and other apps, or give it a dedicated screen.