This is a guest post by Pasi Örn at Visma
I’m working on a new team called Data Insights & Automation. The main driver for me to have this team was that the need for useful, reliable data is everywhere, not just in marketing.
The DIA -team’s initial goal is to raise the awareness and the importance of data in the whole company, and help employees, as well as company management, to make decisions based on high-quality and reliable data.
We are building a data lake where we collect all the data from back-office systems and other data points. Then from that, we can combine data through interactive dashboards, use machine learning, and AI to gain better insights, and drive that data through automation to serve better customer experience.
Break down the data silos!
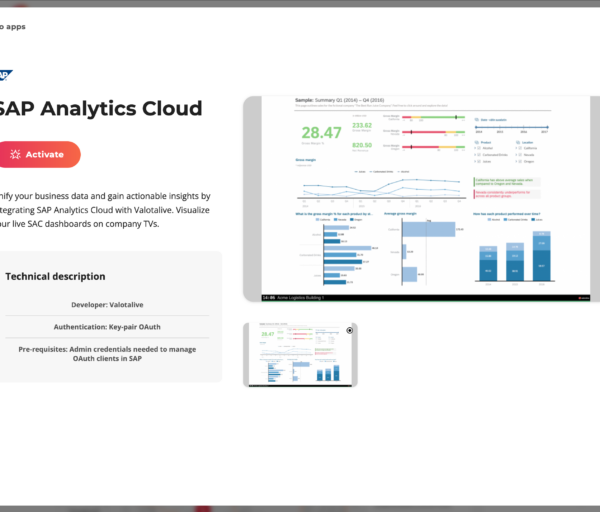
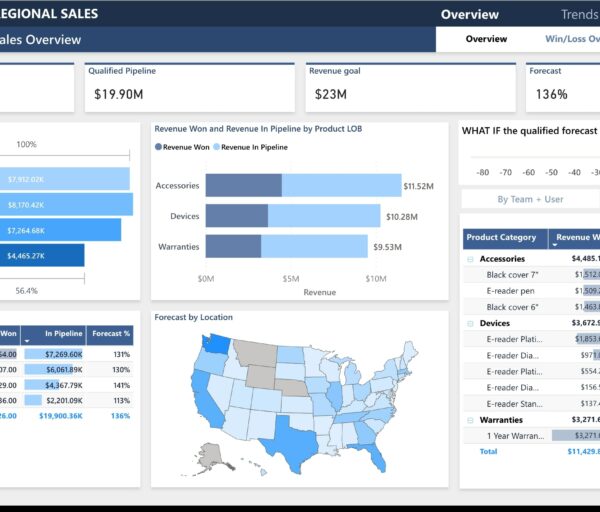
The raw data is first structured in the data lake, and from that, you can serve helpful interactive dashboards using software like Tableau for different teams. Then on the top level, there are these simple KPI dashboards that you can stream with digital signage like Valotalive to various locations within the company.
These simplified KPIs can give useful insights quickly, and because of that, they are an essential part of enabling the availability of your company’s data.
Let’s say you have your monthly meetings where information is shared. If everyone sees these KPIs once per month, we could lose a lot of time between noticing a problem and then seeing if actions we took resolved it.
I know that in a different part of the company, often the own KPIs are followed more closely, but by leveraging the availability of the KPIs for all enables you to break the data silos.
Gain knowledge on your coffee break
I gave this function the name Coffee Break Insights or CBI. With CBI, you give your employees always the live situation of your business every time they go a grab a coffee, tea… or banana.
With a simple sight, you can see if everything is looking good in your system or service, are all ok on customer support, are marketing is on the right track, and is sales keeping up with the leads. Also, sharing positive feedback like from NPS scores can have a high impact on employees.
So what kind of Coffee Break Insights do you have on your company? What CBIs would be great to see on digital signage displays?
This article was originally published on LinkedIn
Pasi Örn works as a Marketing Automation Manager, Data Insights & Automation at Visma. Visma makes businesses more efficient, through offerings of software, commerce solutions, retail IT-solutions, and IT-related projects and consulting. 900 000 customers in Northern Europe utilize Visma’s products and services. The group has over 8500 employees and its net revenue amounted to EUR 1.17 billion
Learn more how to display live Power BI on Digital Signage
Further Reading you might find interesting
Image credits:
Drawing – N.Örn 2019
Coffee cup – Fancycrave1 at Pixabay


