Introduction
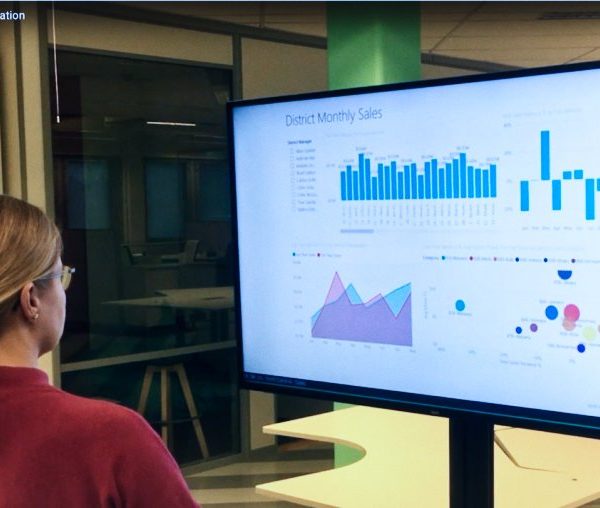
The manufacturing industry is continuously looking for ways to improve efficiency, enhance communication, and streamline operations. Digital signage, coupled with the powerful capabilities of Excel, presents a unique opportunity to revolutionize the way information is displayed, shared, and managed within manufacturing facilities.
This blog post explores how integrating digital signage with Microsoft Excel online can optimize communication, data visualization, and workflow management in the manufacturing industry.
We cover the use cases, business impact and the steps to connect Excel Online with digital information screens in the production facility.
Use Cases – Excel on Digital Signage Screens in Production Facilities
In this chapter we will cover some use cases and the related business impact for Excel spreadsheet data on digital signage.
1 Real time production updates
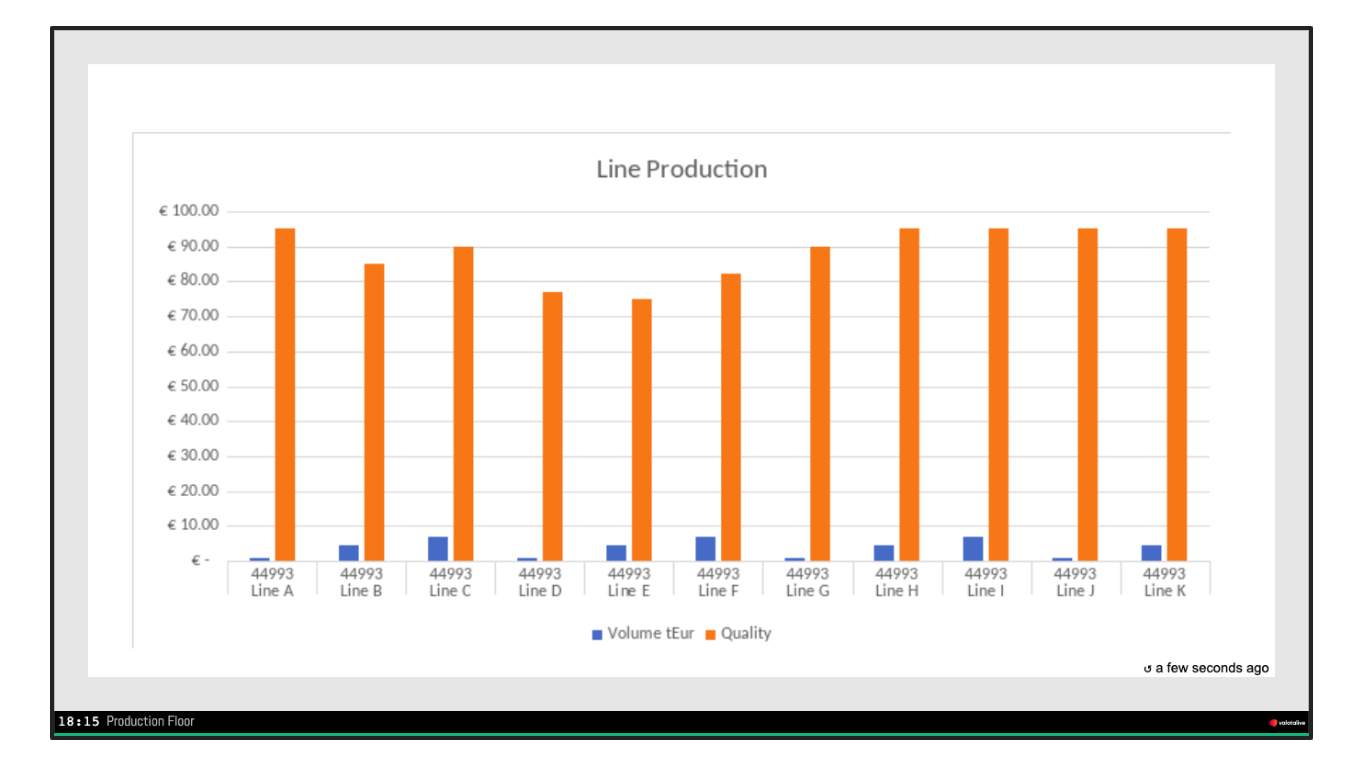
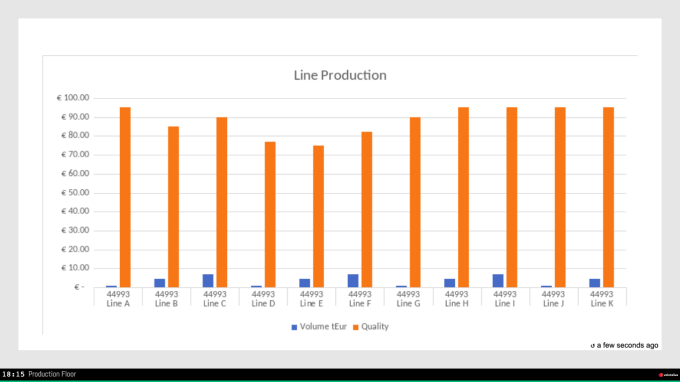
Excel facilitates the tracking and reporting of key performance indicators (KPIs) in the manufacturing industry. It allows manufacturers to create performance dashboards, scorecards, and reports to monitor metrics such as production output, efficiency, scrap rates, and downtime. Excel’s data visualization capabilities enable the presentation of data in charts, graphs, and pivot tables for easier analysis and decision-making.
2 Quality Control
Quality Control: Excel provides tools for recording and analyzing quality control data. Manufacturers can use Excel to create control charts or Pareto charts to monitor process performance or identify variations to implement corrective actions. The dynamic statistical charts about the quality on the production floor screens can aid in quality improvement initiatives.
3 Production Planning
Production Planning and Scheduling: Excel enables manufacturers to create production schedules, allocate resources, and plan workflows effectively. It allows for the creation of Gantt charts, production timelines, and capacity planning sheets. Excel’s formulas and functions can be used to calculate lead times, determine optimal production sequences, and identify potential bottlenecks.
4 Safety KPIs
Excel facilitates the tracking and reporting of key performance indicators (KPIs) in the manufacturing industry. It allows manufacturers to create safety performance dashboards or scorecards. The combination of Excel and digital signage can significantly impact safety and compliance in manufacturing. The displays can show information about near misses, reported incidents, or equipment breakdowns.

Use Cases – Summary
Harness the power of Excel together with digital signage. Display live updates from near real-time production KPIs to performance analytics and safety data. Excel Spreadsheets connected with digital signage holds immense potential to boost efficiency and productivity in manufacturing operations.
How to Connect Excel with Digital Signage?
You will need an Excel M365 (online) account, Valotalive software, a computer and a screen.
Valotalive is a digital signage software enabling companies to manage and automate content on one screen to a fleet of displays. Valotalive comes with a turn-key integration to Microsoft M365 Excel.
Follow these steps to get Excel on production facility displays:
Step 1 Create your Valotalive Account
Sign up to Valotalive – click here (free trial provided)
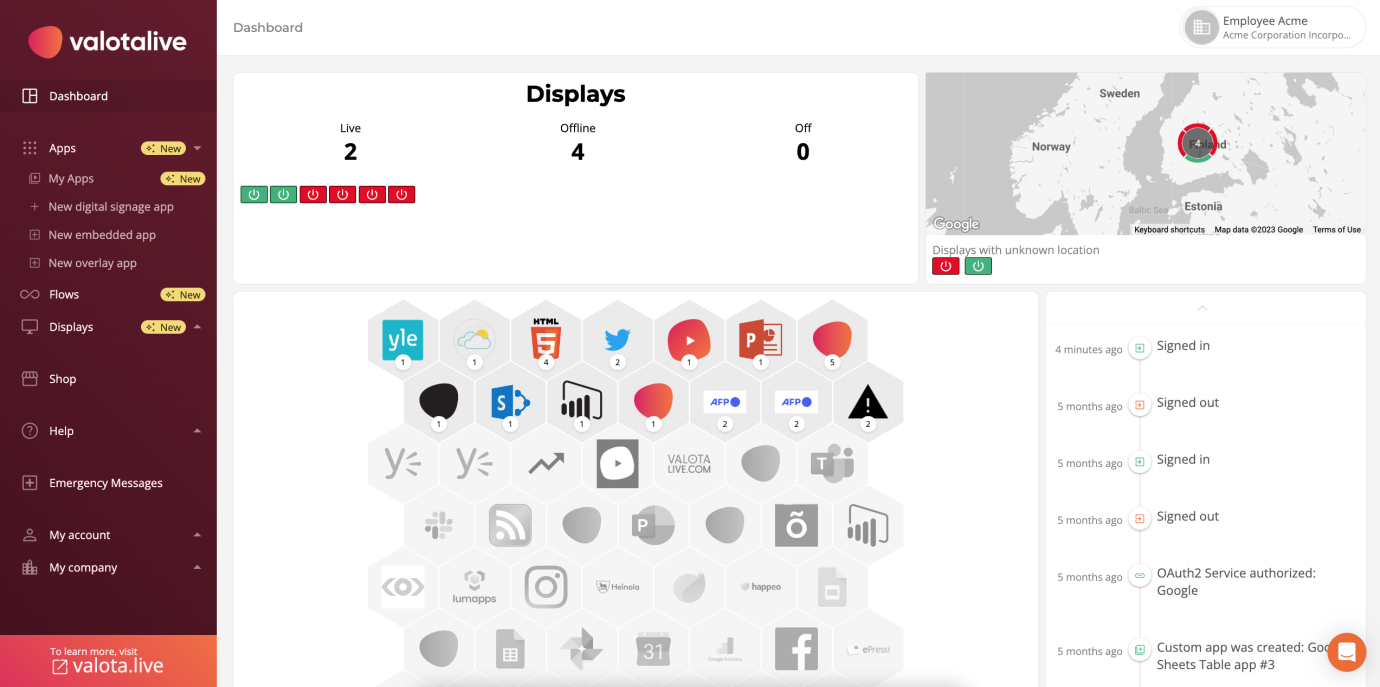
Step 2 Activate your Display in Valotalive
Prerequisites:
- You will need a display. A HD or Full HD display with HDMI input is good.
- You will need a computer that will be connected to the display. You can have a Windows or Chrome OS on your computer.
2.1 Download Valotalive to your computer
You can download Valotalive’s player application from Microsoft Store or Chrome Web Store to your computer. With Valotalive you can centrally manage the content on one or multiple (a group) displays.
2.2 Run Valotalive on your computer.
Open Valotalive application. Notice the PIN code on the screen once Valotalive is running.
2.3 Pair your display with Valotalive
Click Displays -> All Displays -> New Display -> Claim with code to pair your screen with Valotalive. Give the screen 2 minutes to pair it with your account.
Step 3 Activate the Excel Application in Valotalive
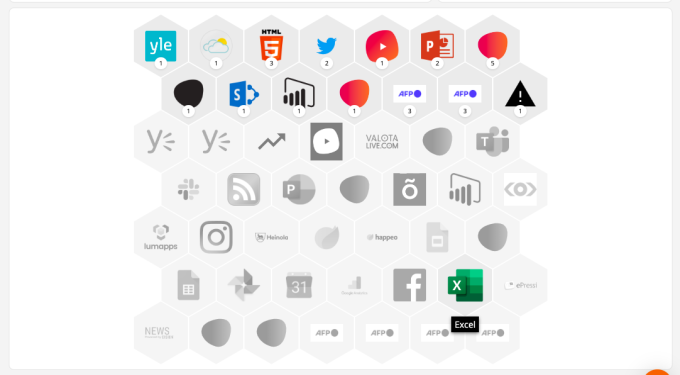
3.1 Click the Excel icon on the front page
Locate the “hexagon” on the front page and click the Excel icon to activate the Excel application.
3.2 Authenticate Valotalive with Excel
Authenticate Valotalive with Excel using your Microsoft credentials. This enables Valotalive to connect with your Excel account. Note you need to own the file to be able to select it in the app settings after the authentication.
Step 4 Go live – add your Excel App to the displays
Once you have saved your Excel app, you can add your app to a Flow linked to a specific display or display group(s). This will be done in Valotalive. Read more here
Once the Excel app is running on your Valotalive displays(s) it will show the latest content and data in the selected Excel file. You can choose to display table data or your charts in your file. The data will update automatically every 15 minutes.
Thank you for reading – this post has been written with the assistance of ChatGPT AI.
