Microsoft Power BI Overlay for Interactivity
Enhance your Digital Signage experience with Valotalive’s Power BI Overlay app.
Effortlessly switch from the dynamic Valotalive Flow to an interactive Power BI display with just a click of the mouse, ensuring a seamless transition from the view mode to interactive setting.
- Easy setup
- No Credit card needed
- 14-day free trial
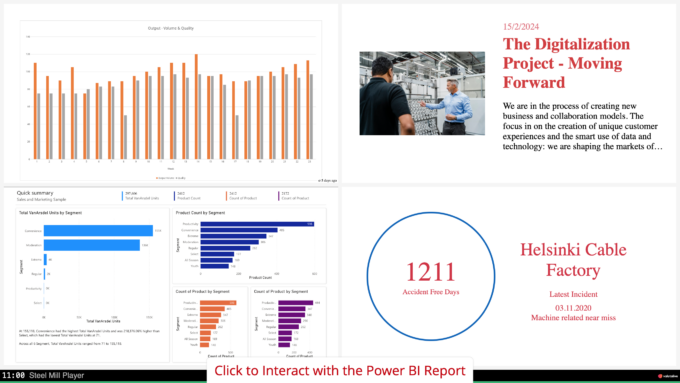
Switch from Flow to interactive Power BI report
In the default view, your screen showcases the Valotalive Flow – a programmatic playlist curated for your audience. The selected Power BI report can either remain discreetly hidden or seamlessly be part of the Flow.
When the need arises to delve deeper into the Power BI report, simply halt the Flow and switch to the report by clicking the mouse. The report takes center stage, becoming the sole content until you decide to exit, at which point the Flow resumes.
Key Features of the Power BI Overlay App
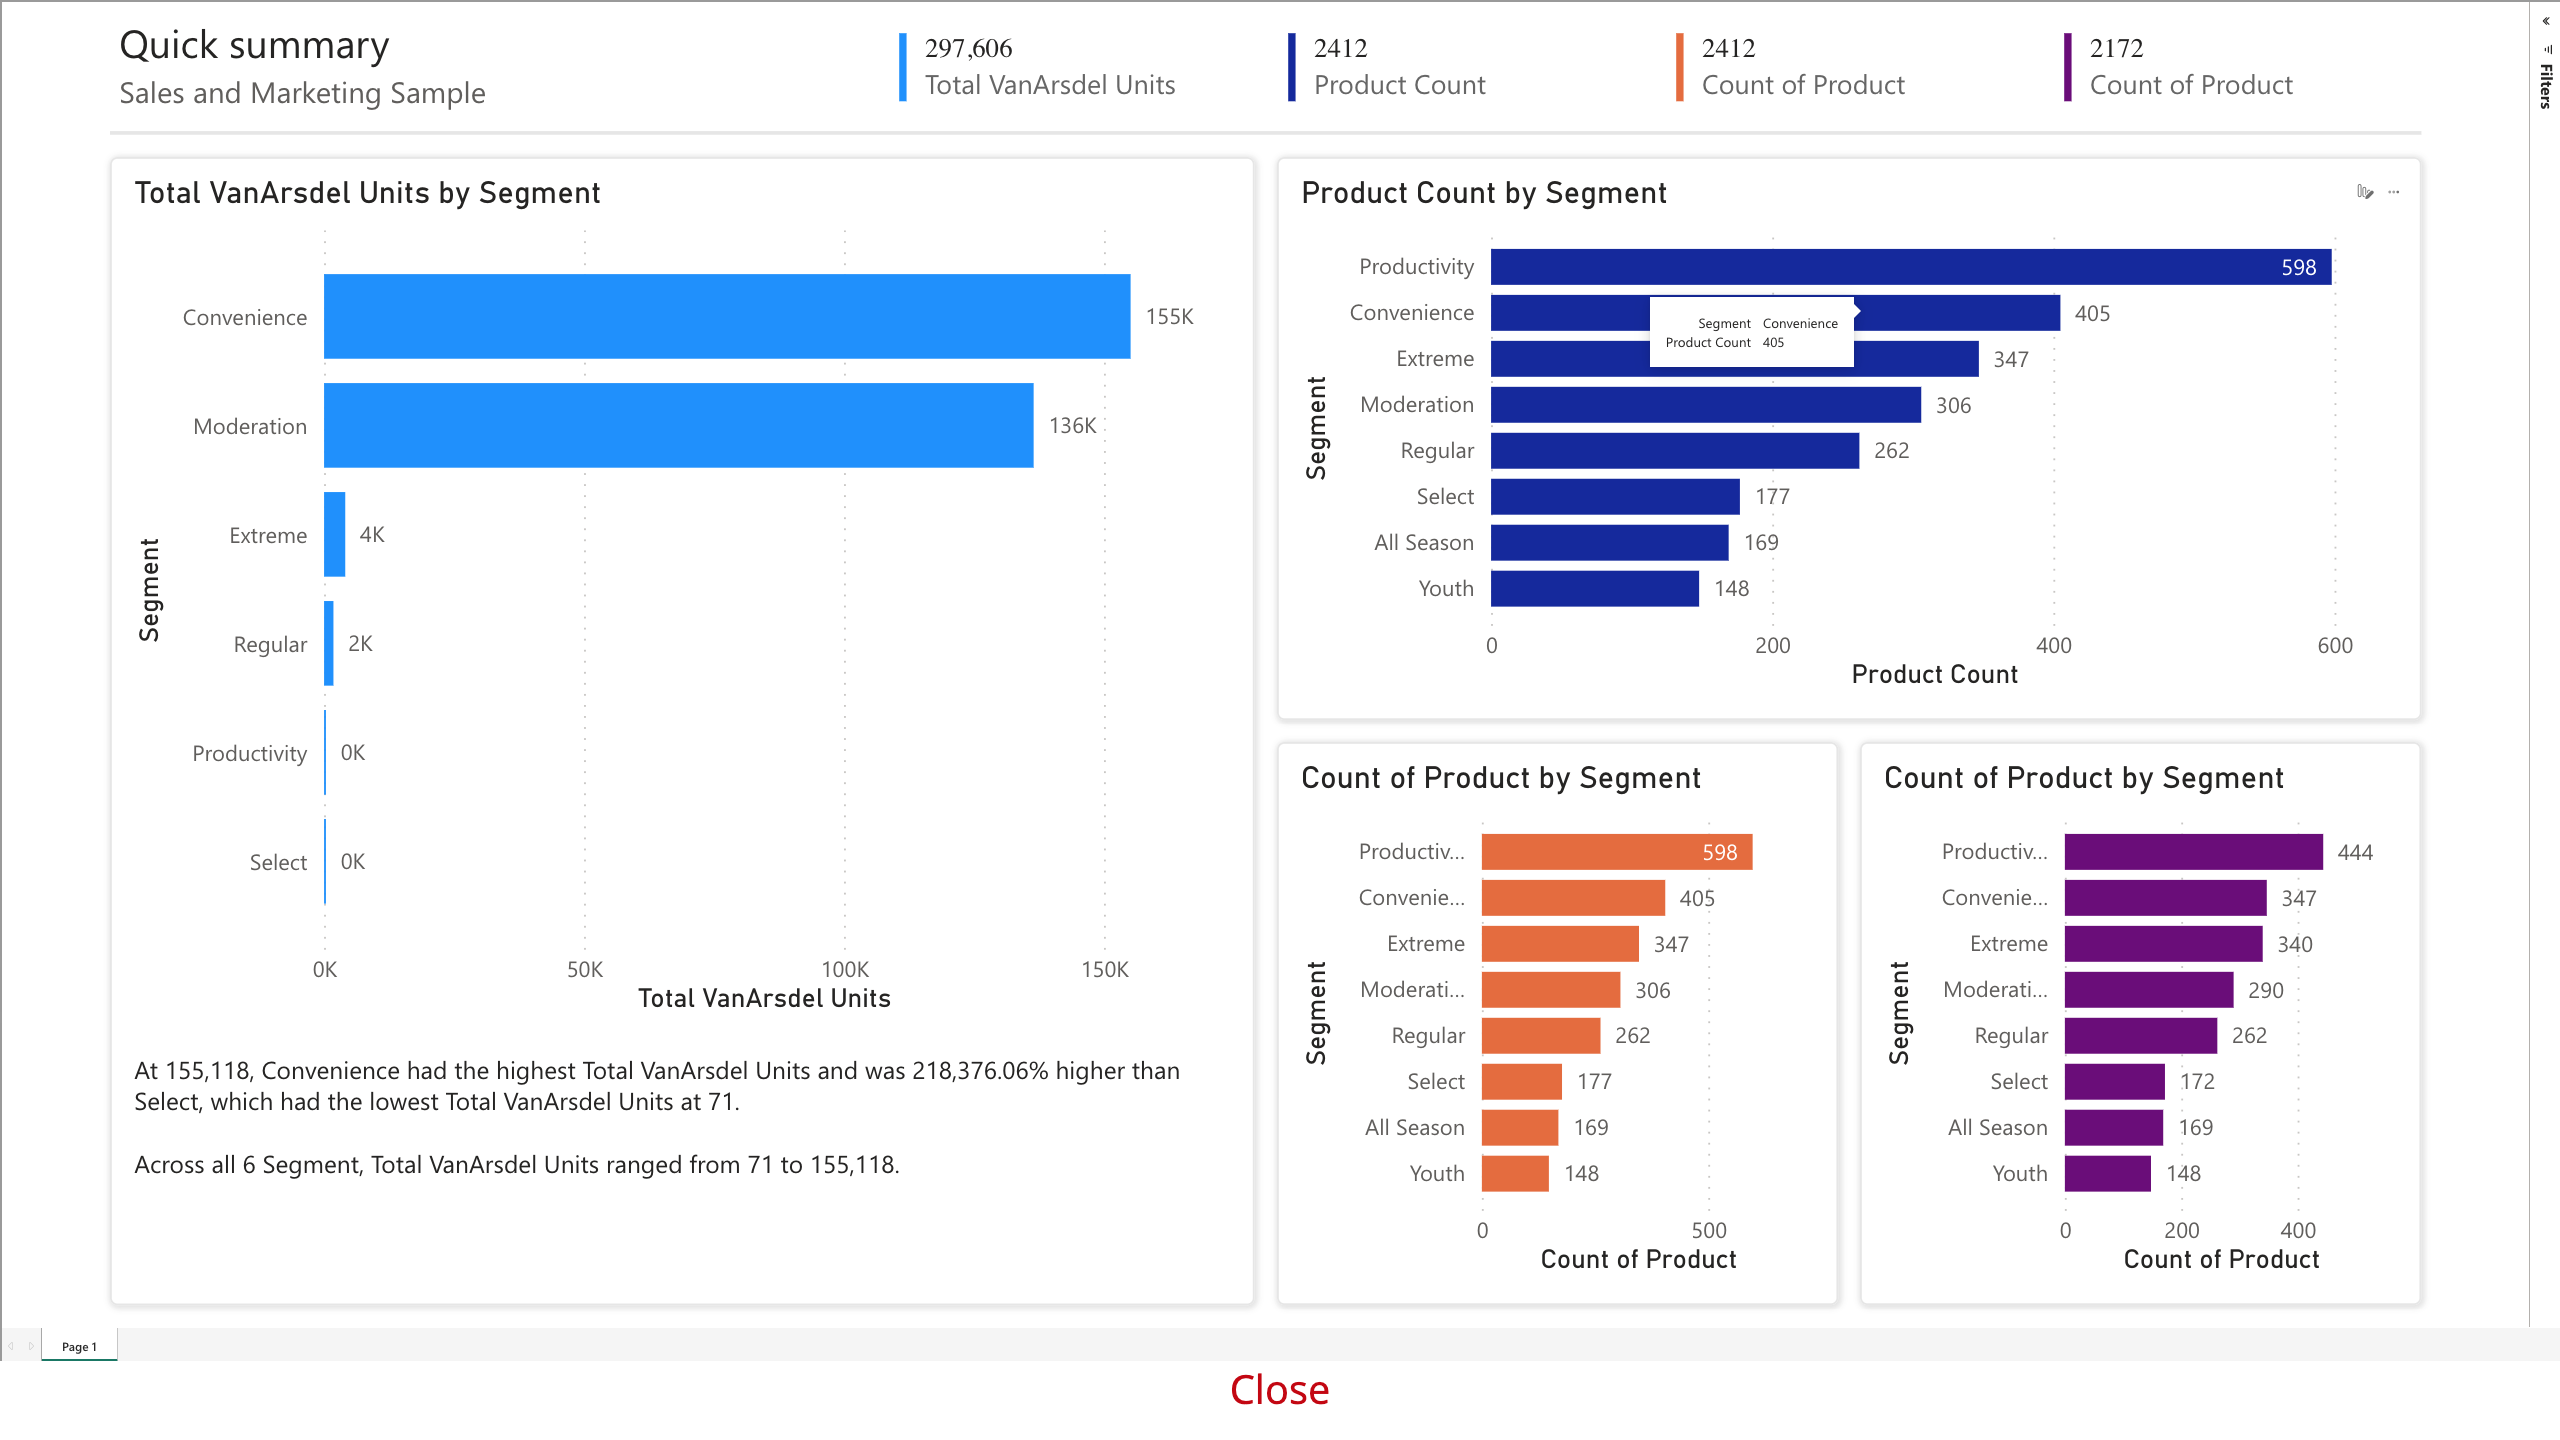
1 Customised Power BI Report Display
- Configure the Power BI Overlay app to exhibit a specific Power BI report tailored to your preferences.
2 Automatic Hiding
- When assigned to a display or groups of displays, the Power BI report remains concealed by default, ready to be revealed with a simple click.

3 Effortless Mode Switching
- Seamlessly transition from the Valotalive Flow to interactive Power BI by clicking the mouse, ensuring a smooth and engaging user experience.
4 Call to Action Integration
- Enhance audience engagement by displaying a custom call to action when the display is in Flow mode. This informs viewers about the availability of interactive content, prompting them to explore further.
Power BI Overlay + Shop Floor Boards

Integrate the Power BI Overlay seamlessly with the Shopfloor Board in Valotalive
Leverage the Multiview app in Valotalive to craft a comprehensive shop floor board, consolidating information from various data sources. Showcase production data from Excel, operational dashboards from Power BI, company news from SharePoint, and an Accident-Free Days counter for heightened health and safety awareness.
The default display features the Shopfloor Board, offering a holistic view. Easily transition to interactive mode when the need arises, with just a click of a mouse.