Would you like to learn how to securely display Google Charts on your office digital signage displays?
Is it possible to automate the entire process so that when you update your data in Google Sheets your Chart on Digital Signage displays will update as well?
You can do all this using a digital signage service, such as Valotalive, that connects with Google Workspace apps.
We’ll cover all the necessary steps in this blog, so keep reading to learn more about it.
Google Sheets
If you are using Google Workspace, formerly known as Google G Suite, you are familiar with Google Sheets. Google Sheets is the spreadsheet application included in the Google Docs office suite.
Google Sheets allow users to analyze, calculate and present different data sets. It is possible to collaborate with other users and edit and format the file in real time.
Google Charts
It is possible to add a chart to your spreadsheet. Charts can be anything from Line to Combo chart to Tree map. There are multiple options of charts to be used in Google Sheets.
Digital Signage
Digital Signage is a service that makes it possible to control and target the content on a network of multiple displays around the workplace. Companies use digital signage for employee communication in the offices and production facilities.
Modern digital signage services connect with the different business tools, such as Google Workplace applications. This increases the productivity as you can display content, dashboards and different data visualizations that already exist.
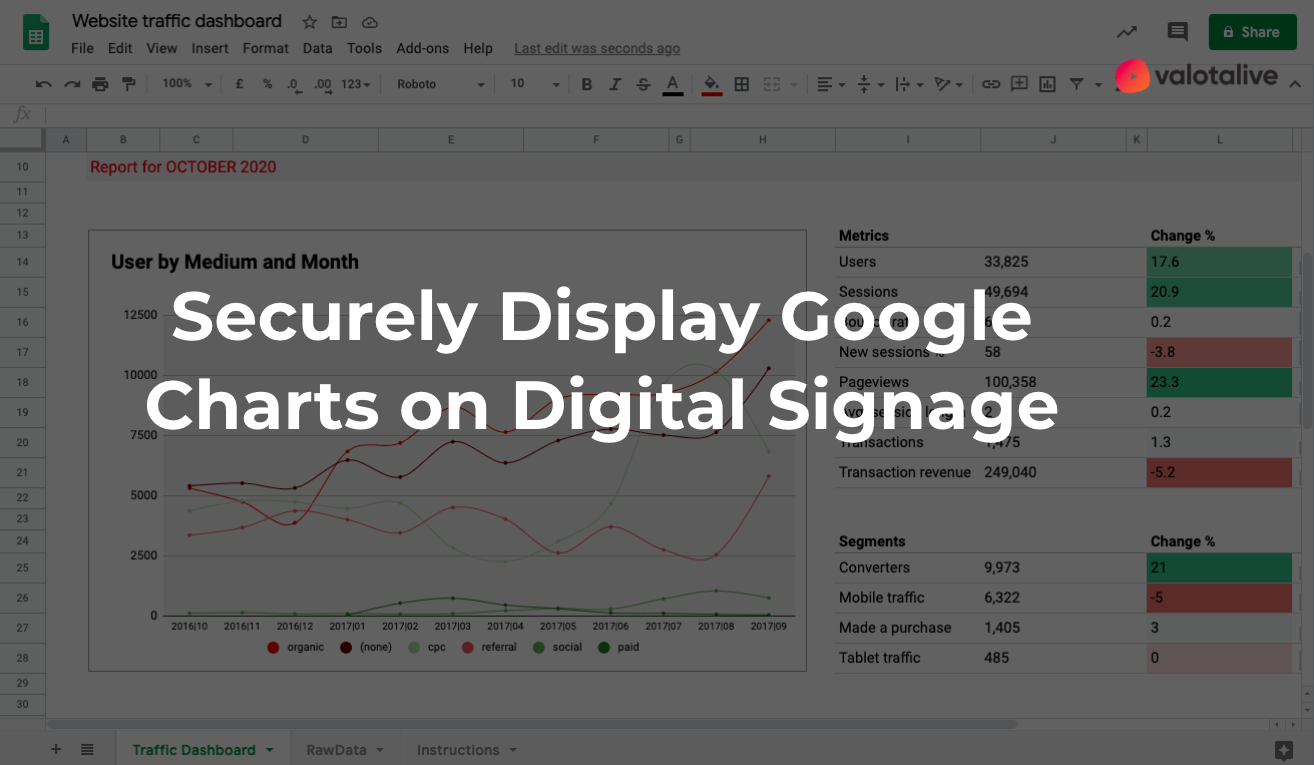
Google Charts on Office Displays
Let’s say you have the need to engage or motivate employees around the workplace. We know that visualizations are a great way to communicate information that drives action.
Now, you might have the right KPIs or dashboards as a Chart in Google Sheets and would like to display that on Office TVs to a specific group of employees.
How to do that AND can you do that without making URLs public to maintain the right set of data security? Keep reading to learn more about.
How to display Google Charts on Digital Signage?
Follow these steps to securely display Google Charts on digital displays in your office or production facility.
Activate your digital signage service
First you’ll need to activate Valotalive digital signage service. Valotalive makes it possible for you to target content to the right group of employees and to connect with Google Apps. You’ll need a media player that runs Valotalive. Connect this media player to your office display. If you have multiple displays, you’ll need multiple mediaplayers.
Activate Google Slides app in Valotalive
Yes, that is correct, we mean Google Slides. Google Slides app makes it possible to to display the chart with an optimal layout on the displays. With Google Slides app you can connect with Valotalive nice and secure with Google Sign In authentication.
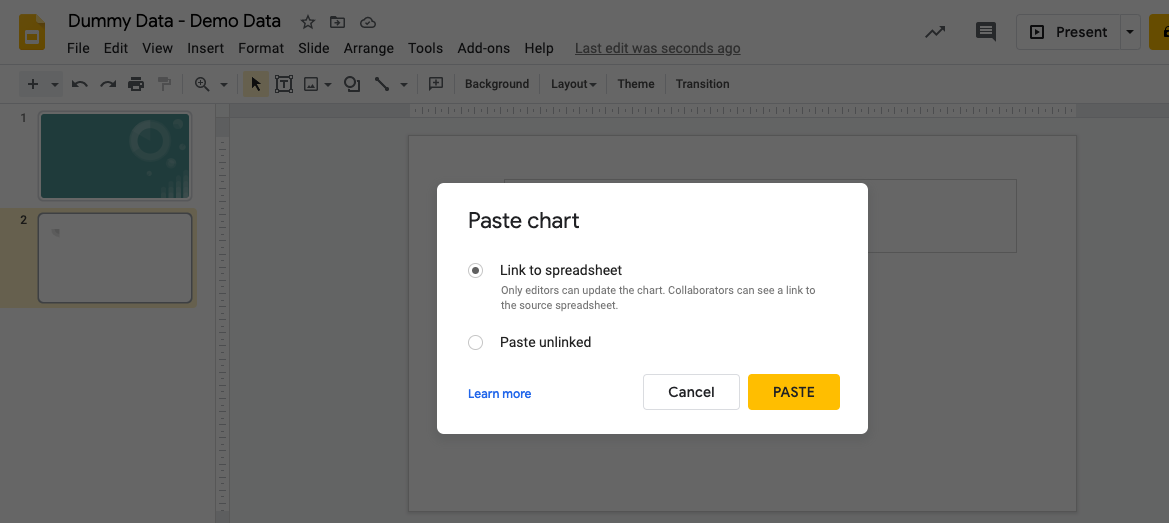
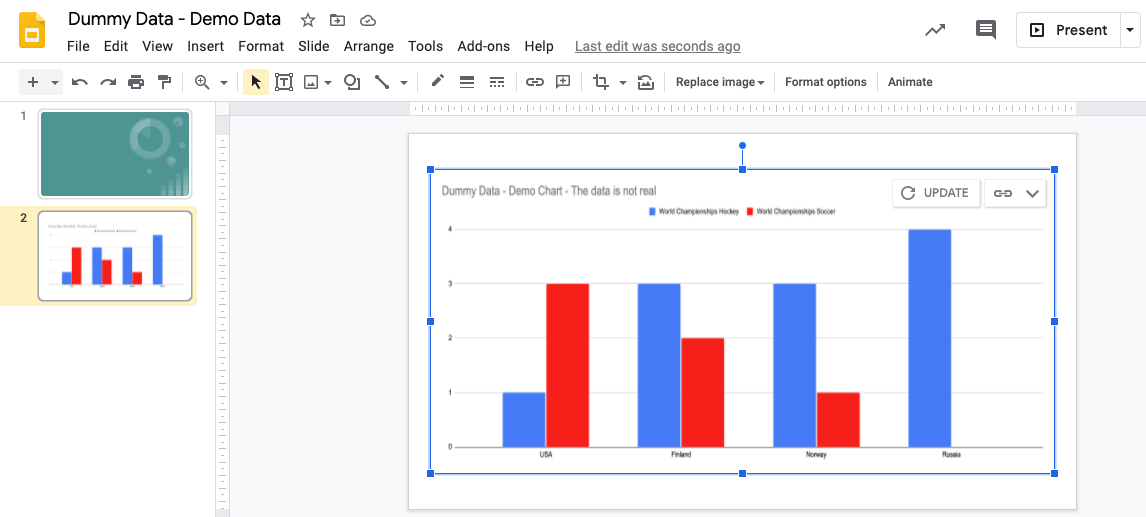
You can insert your chart to Google Slides file by pasting it. While doing so you can also link the chart to the existing file. This link makes it easier to update the chart as the data updates.
There’s only one challenge in the process. That is that the chart on the slide requires you to click “update” once the data has been updated.
So it’s not a fully automatic process…yet.
Trigger automated updates for Charts in Google Slides
This is a bit more advanced part of the blog, but surely makes your life easier. This best practice actually came from our customer. A big shout out to Jussi, thanks for sharing this information along with the script with us!
With Google Apps Scripts you can programmatically modify Slides presentations as an example. And that’s what we are exactly doing in this case.
Step I
Open your slide file where you have pasted your chart. To make this update based on the selected triggers, navigate to “tools” and “Script editor”
Step II
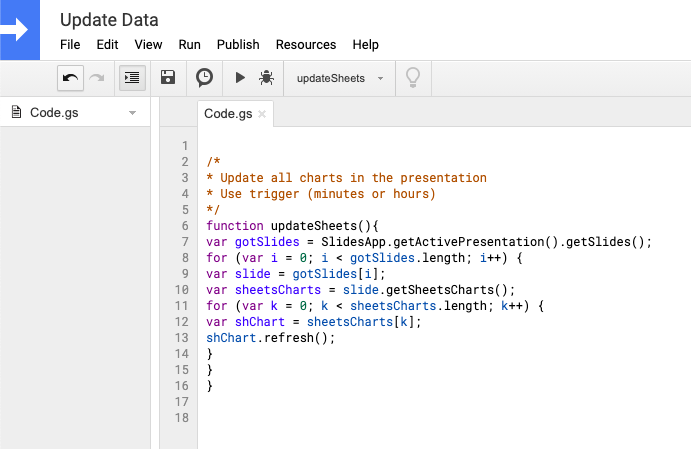
Paste this bit of code in the script editor, as shown in the image below.
/*
* Update all charts in the presentation
* Use trigger (minutes or hours)
*/
function updateSheets(){
var gotSlides = SlidesApp.getActivePresentation().getSlides();
for (var i = 0; i < gotSlides.length; i++) {
var slide = gotSlides[i];
var sheetsCharts = slide.getSheetsCharts();
for (var k = 0; k < sheetsCharts.length; k++) {
var shChart = sheetsCharts[k];
shChart.refresh();
}
}
}
Name your project and save.
Step III
Now, let’s add some triggers. This means that we’ll tell the script when to run. We are still in the Script editor. Click the trigger icon (the clock type of symbol) on the right side of the save icon.
Click the “Add trigger” button in the bottom right to set your desired action.
There are multiple options for time driven triggers. Keep the default settings and make sure you have the “time driven” chosen in the “event source” setting.
Choose from the available options:
- Minutes
- Hour
- Day
- Week
- Month
As an example if you’d like your report to update every hour you would like to choose the “hour timer” and then make sure the “hour interval” is set on “Every hour”
Click save and you are done. Well done!


