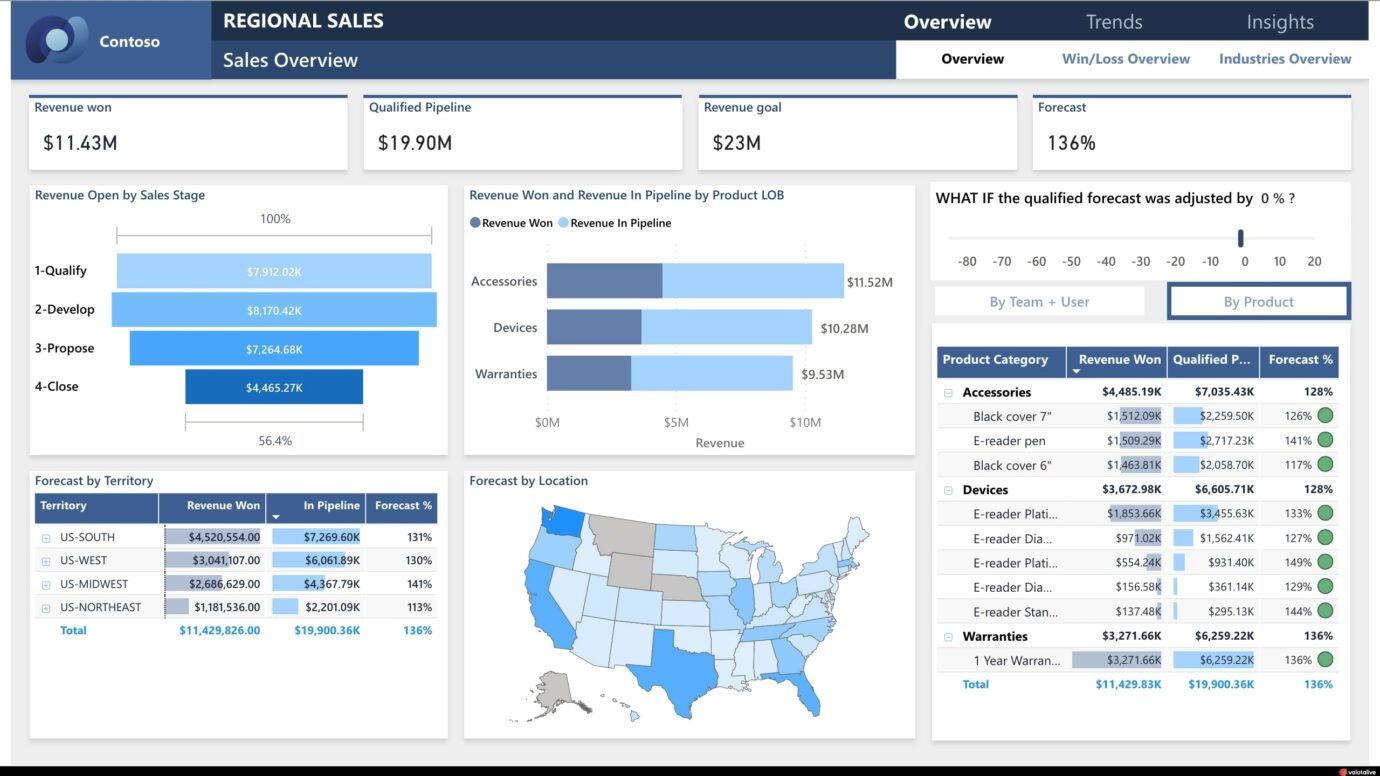
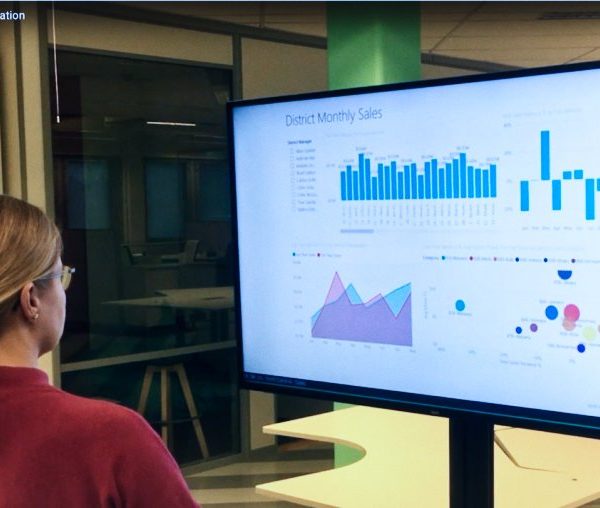
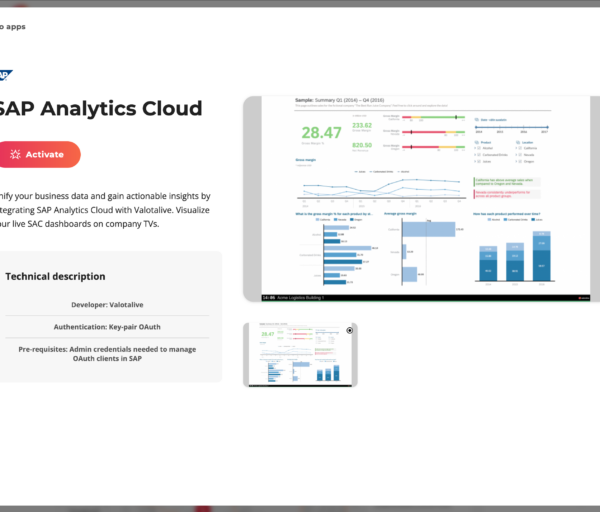
This blog covers the use cases and the benefits of displaying Microsoft Power BI on Digital Signage screens. We also introduce Valotalive’s digital signage integration with Microsoft Power BI, and the steps to display your Power BI Reports on Digital Signage displays in a secure way using Valotalive.
Learn more about Power BI with Digital Signage and displaying your Power BI reports on your workplace displays without making any of your report URLs public.
Summary:
- Valotalive offers a secure integration with Microsoft Power BI, enabling the display of reports on digital signage without public URL exposure.
- The integration leverages native Azure AD authentication for enhanced security.
- The process for displaying Power BI reports involves a Power BI account and report, a Valotalive account, display activation in Valotalive, Power BI app authentication, app setting adjustments, and assigning the app to a display.
- Valotalive is compatible with various Power BI licenses and provides a free trial for testing the service.
- Digital signage serves as an effective tool to communicate with all employees, including non-desk workers, by delivering relevant information directly to their work environment.
Table of Contents:
You can use the links below to jump directly to specific sections.
- Why Should You Share Your Power BI Reports on Digital Signage
- Introducing Valotalive – Microsoft Power BI Integration
- The Steps to Display Your Power BI Report on Digital Signage
Keep reading to learn more ⬇️
Why Should You Share Your Power BI Reports on Digital Signage
With today’s tools, the data can be collected, analyzed, and summarized into dashboards with easy-to-use tools, such as Microsoft Power BI.
The data visualizations make it easier to understand the trends, patterns, and the whole story around the data.
You now have actionable information.
BUT
Creating a great-looking dashboard is not enough. You need to get your KPIs in Insights in front of the right people in order to drive action.
Drive action with Digital Signage & Business Insights
The truth can be found in the data, they say. So you’ve got data, but what next?
You need to communicate your insights and information to drive action throughout the workplace. Data visualization is the key for employees to understand the bigger picture. Visuals are more engaging than the raw data.
Data-driven communication is key, and digital signage displays are the tool to reach all employees, including non-desk workers, precisely where it matters most: on the shop floor, in logistics centers, or within warehouses.
How Customers Use Power BI on Digital Signage
Data-driven communication in practice means that we are sharing actionable information and visualizations around strategic domains, such as:
- Sales KPIs
- Health & Safety records
- Production Data
- Financials
- Quality
- Employee Incentive KPIs
Power BI + Valotalive Digital Signage is a perfect combination to drive transparency within your organization.
Read more about how Rexel Improved Production Floor Communication by Sharing Power BI Data on Digital Signage
Introducing Valotalive – Microsoft Power BI Integration
The secure way to display your Power BI reports on Digital Signage
Valotalive has made it easy to share your MS Power BI dashboards or reports with your employees on digital signage screens around the workplace.
The company introduced the secure integration between the platforms already in 2018. Most likely the first digital signage software to do so. Valotalive is a Microsoft Network Partner.
Native Authentication to ensure high Security for you
Valotalive Power BI Digital Signage integration is based on native Azure AD authentication, making it a secure way to display your dashboards.
Authenticating Valotalive with MS Power BI cloud means that you do not need to make any reports / dashboards public to show them on Digital Signage displays.
The Steps to Display Your Power BI Report on Digital Signage
1. Power BI Account & Report
Make sure you have a valid MS Power BI cloud account.
- Licensing: Valotalive works with any Power BI license. If you don’t have a Power BI account yet, you can find further information here about Power BI licenses.
- Reports: Once you have an account, make sure you have your data in place and a report that you can display. You can read further information here about getting started with Power BI
2. Valotalive Account
Valotalive, a digital signage software designed for the workplace, enables the display of Power BI reports across multiple screens within different locations, all managed from a central platform.
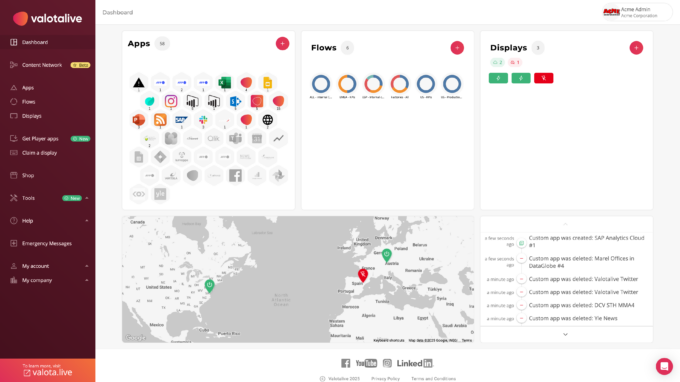
Activate your Valotalive account, you can do it here
If you have not done so already, you can test Valotalive today as a FREE trial is provided for you.
If you want to learn more, you can read further information here about getting started with Valotalive.
Once you have activated your account, you will be taken to the Valotalive main page. Where you can do many things, but most of all, you can find your Power BI app icon there.
Read further👇🏼
3. Activate Your Display in Valotalive
Make sure you have an active display in Valotalive. You may test the service with a Valotalive My Display (Chrome Extension) or a separate screen (Windows computer, ChromeOS, Samsung Tizen) during the free trial.
Later, you’ll need a media player (a small computer) to connect Valotalive digital signage software to your office TV. You have a couple of options: either use an all-in-one SOC display or a separate media player.
Both options offer distinct benefits, which we’ve explored in more detail in this blog post. Please read it for a deeper understanding of your choices.
4. Activate the Power BI app in Valotalive & authenticate with your Microsoft Credentials
Once you are in Valotalive activate your MS Power BI Dashboards or Report app. We provide you with two different apps to suit your preferences (Reports or Dashboards)
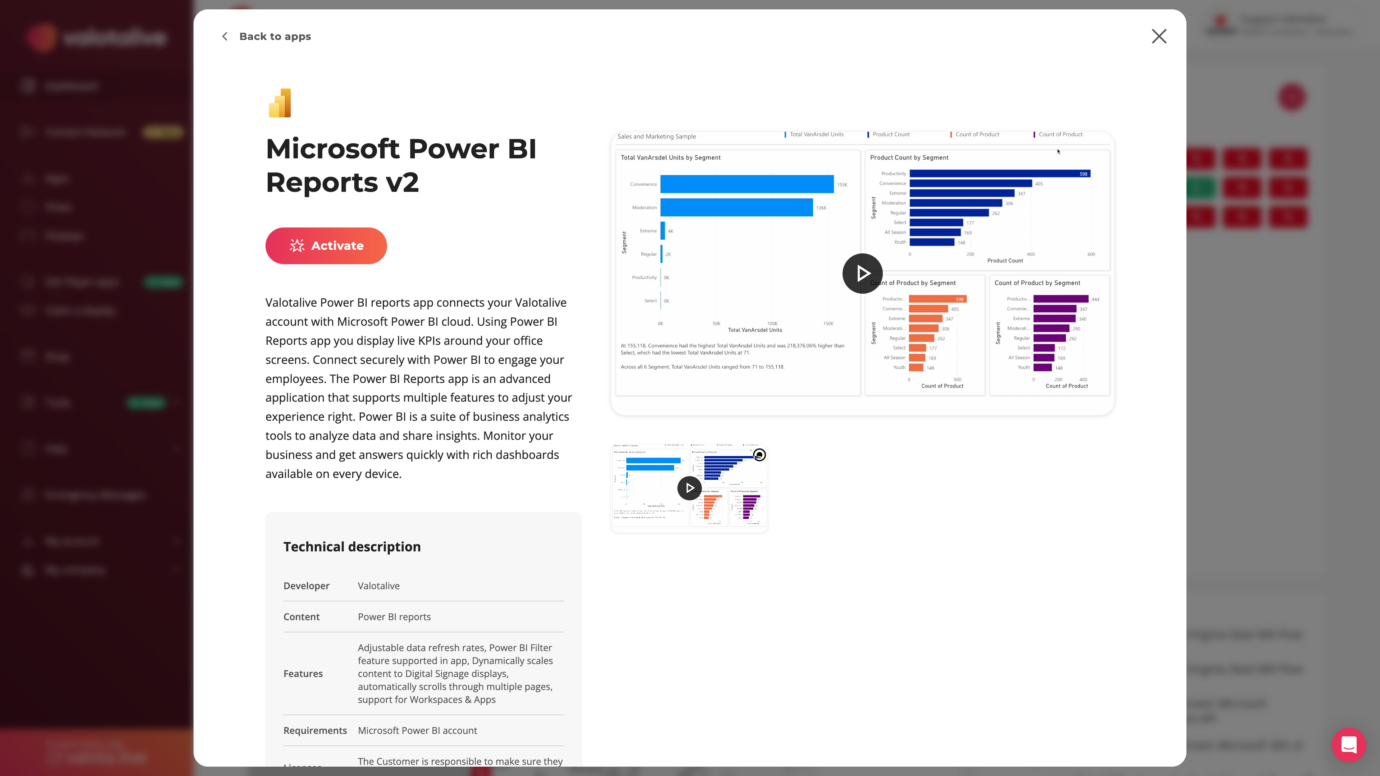
- As one of the first steps, you will be asked to authenticate Valotalive with MS Power BI cloud using your MS credentials.
- Valotalive supports Microsoft Azure AD authentication to enable the best possible level of security for you:
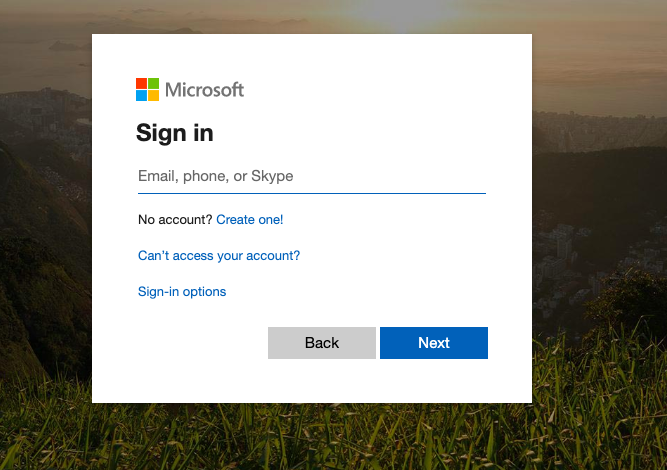
Enter your MS Power BI credentials in Valotalive to proceed, as shown in the image. You will then be taken back to Valotalive settings.
5. Adjust your Power BI Digital Signage app settings
In app settings, choose the report/dashboard from the drop-down menu and give further preferences in the advanced settings. You can scroll through the different tabs in Power BI Reports.
6. Assign Your Power BI app to Your Display
This screen capture video will go through the steps explained above related to Valotalive – Power BI app integration.
The last step is to assign your Power BI app to your Valotalive display. Click the “Displays” tab, open your display and click “Add an app”. Locate your Power BI app in the drop-down menu and click “Ok”.
You are all set and your Power BI Report will start to play on your display.
Read more about Valotalive’s Power BI App
Further Reading you might find interesting
What is Workplace Digital Signage
How to Use Filters in Power BI on Your Digital Signage to Target Your Reports Better
Top 5 Power BI Visual Design Best Practices (a blog post by PowerpivotPro)
