Updated 21.8.2020
In this post we will focus more on the advanced, and highly requested, feature to use filters feature when displaying Power BI Reports on Digital Signage screens.
This is a follow up article to our previous blog post about Microsoft Power BI on digital signage. If you are only beginning with Power BI and Digital Signage, we recommend you to start with this first: “How to share Power BI dashboards on digital signage”
Now the good stuff.
It is possible for you to target your reports easier and better than before. Valotalive is now compliant with Microsoft Power BI Basic and Advanced filtering.
We will provide you with an introduction to Power BI filters and the steps how to apply filters in the app settings.
Let’s start with a bit of introduction first.
Power BI Filters
Intro to Power BI Filters
Filters remove all the data from the report, except the one that you would like to focus on and show on your report.
You can apply filters (page, visual, report, drill-through) in the Filter pane. Applying any of the filters have direct effect on your report.
With filters you can go from a high level report towards more detailed information to serve your target audience better.
Microsoft have done a great job with the instructions around Power BI. They have a vast amount of articles around ie. filters if you require further, detailed information.
We are including further links regarding each section at the bottom of this post. ⬇️ ⬇️
Power BI Filters in Digital Signage App
Valotalive Workplace Digital Signage is compliant with Microsoft with the Filters in Power BI. This means that you can apply the same filters in Valotalive Power BI Digital Signage app as you would in your report in Power BI Online or Desktop.
Using filters in Power BI Digital Signage app, instead of the report itself, saves you time from creating multiple reports and keeps your Power BI folders uncluttered and clean.
You can use one report that includes the required information, and then create multiple digital signage apps out of that report to serve your different audience groups relevant and targeted reports.
Power BI Filters on Digital Signage – An example
Let’s say that you have your global sales report and you would like this to be displayed around the sales offices to engage and motivate your teams. You want to target the right view for the right audience.
This video below shows the different views of our example report as seen on Digital Signage Displays:
You can create multiple digital signage apps based on that one Power BI report. Each app would show the same report, but with a different view.
In this example we have three apps for Digital Signage Displays around our offices.
1. One global high level view of your sales for all your office displays
2. One view for North Carolina. All visualisations would show data for North Carolina only on all your displays in your offices in North Carolina.
3. One view for Maryland. All visualisations would show data for Maryland only on all your displays in your offices in Maryland.
How to Use Filters in Valotalive Power BI Digital Signage App
Before proceeding, make sure you have a valid Valotalive account for displaying Power BI Reports securely on your office displays. In case you do not yet have an account, you can use a Free Trial to test the service.
1. In Valotalive go to your Power BI Reports app settings
Prior this step we have authenticated Valotalive with our Power BI account (please see our previous post for further information about secure authentication)
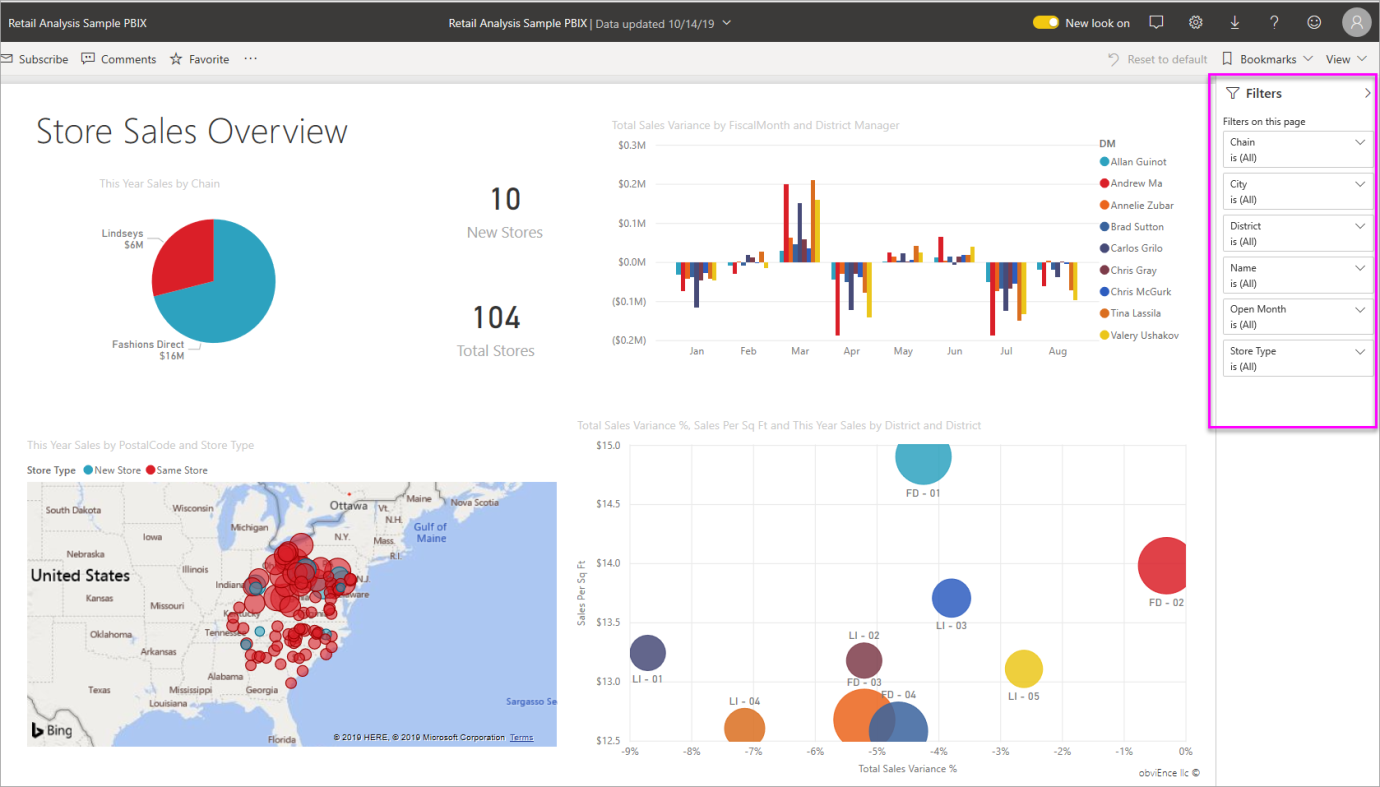
As a first step, in your Valotalive Power BI App settings, choose the right report that will have your required data:
In this example we chose our Retail Analysis Report from the drop down menu in our app settings.
2. Find your Table and Column names in your Power BI Report
In our example report we can see that we have stores i.e in North Carolina. We’d like our display to show the live report only for North Carolina. Let’s locate the right values from Power BI to create a filter for this Digital Signage app.
Note – When you hover your mouse over the field name (column) in your Power BI report you can also locate the name of your Table, as shown in this image:
In this case the Table is ‘Store’ and the Column is ‘Territory’
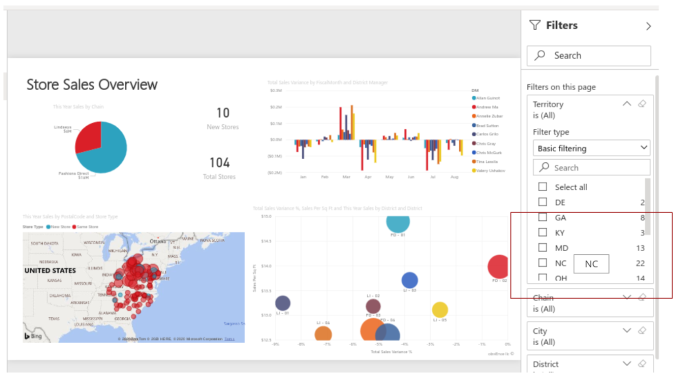
3. Choose your value
We wanted the display to show the stores in North Carolina only. In this report the value itself would be ‘NC’
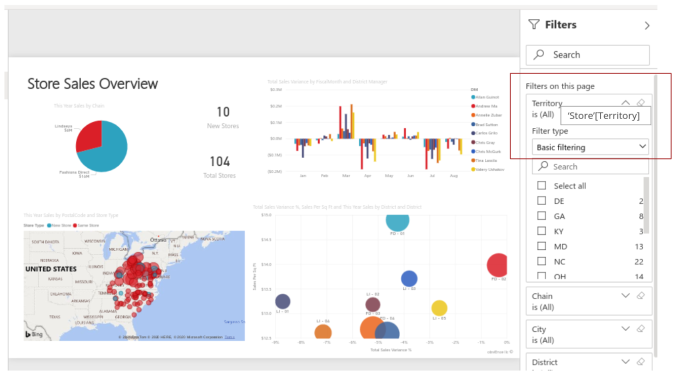
4. Add filter in Valotalive and Input your values
Input your values in advanced section in Valotalive Power BI App settings. To create this specific filter in this case:
– table is ‘Store’
– column is ‘Territory’
– the value is ‘NC’
Note that the text is case sensitive.
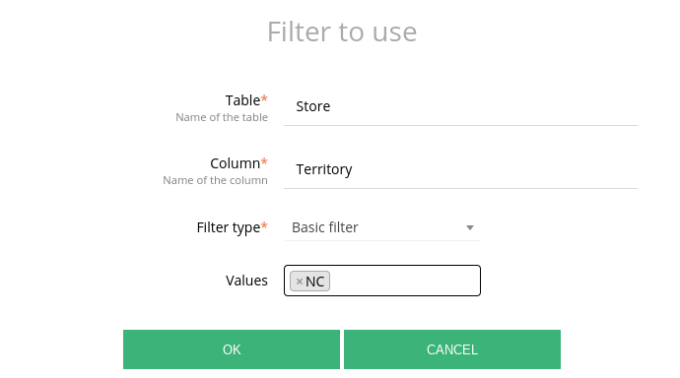
Once you are done and hit ok, the filter should look as seen below. You can apply multiple filters up to maximum amount of six. It is easy to remove the filter clicking the red minus ( – ) icon on the right.

Remember to save your app settings in Valotalive and you are ready to assign your app to your flows and displays.
Note – The filters always depend on the specific report in use. The above mentioned example is based on Microsoft’s sample data called Retail Analysis Sample. You can download the sample here.
In case you would need further information see the section below. ⬇️
Further reading about Power BI and Digital Signage
More Resources around Power BI by Microsoft
Filters and highlighting in Power BI reports


